Puerto Rican vs Pakistani Unemployment Among Youth under 25 years
COMPARE
Puerto Rican
Pakistani
Unemployment Among Youth under 25 years
Unemployment Among Youth under 25 years Comparison
Puerto Ricans
Pakistanis
18.4%
UNEMPLOYMENT AMONG YOUTH UNDER 25 YEARS
0.0/ 100
METRIC RATING
342nd/ 347
METRIC RANK
11.3%
UNEMPLOYMENT AMONG YOUTH UNDER 25 YEARS
94.0/ 100
METRIC RATING
100th/ 347
METRIC RANK
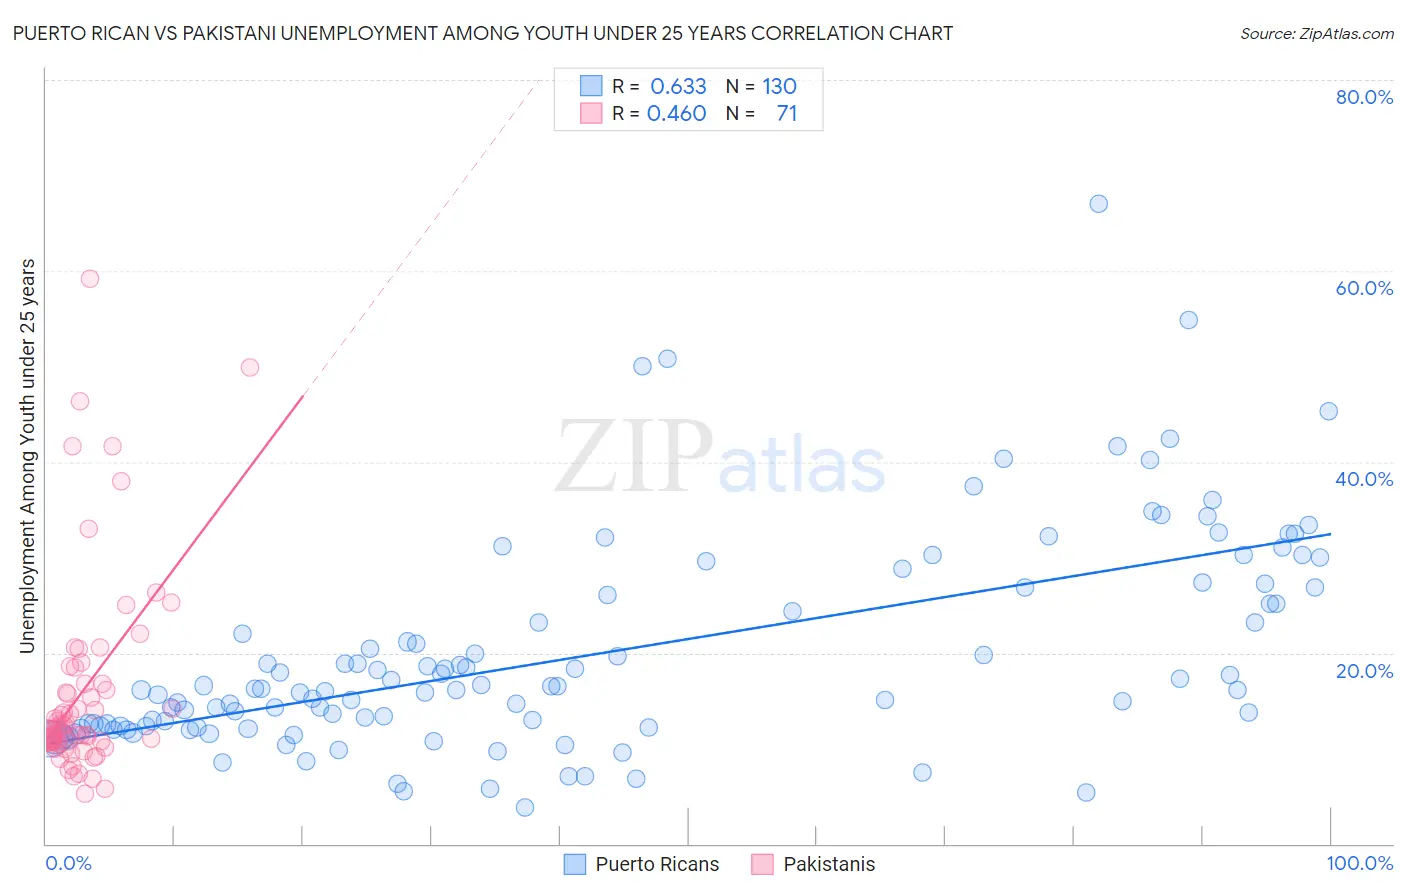
Puerto Rican vs Pakistani Unemployment Among Youth under 25 years Correlation Chart
The statistical analysis conducted on geographies consisting of 515,241,059 people shows a significant positive correlation between the proportion of Puerto Ricans and unemployment rate among youth under the age of 25 in the United States with a correlation coefficient (R) of 0.633 and weighted average of 18.4%. Similarly, the statistical analysis conducted on geographies consisting of 332,790,567 people shows a moderate positive correlation between the proportion of Pakistanis and unemployment rate among youth under the age of 25 in the United States with a correlation coefficient (R) of 0.460 and weighted average of 11.3%, a difference of 63.2%.
Unemployment Among Youth under 25 years Correlation Summary
| Measurement | Puerto Rican | Pakistani |
| Minimum | 3.8% | 5.2% |
| Maximum | 67.0% | 59.2% |
| Range | 63.2% | 54.0% |
| Mean | 19.8% | 16.0% |
| Median | 16.2% | 12.0% |
| Interquartile 25% (IQ1) | 12.3% | 10.8% |
| Interquartile 75% (IQ3) | 26.0% | 16.8% |
| Interquartile Range (IQR) | 13.7% | 6.0% |
| Standard Deviation (Sample) | 11.1% | 10.7% |
| Standard Deviation (Population) | 11.1% | 10.6% |
Similar Demographics by Unemployment Among Youth under 25 years
Demographics Similar to Puerto Ricans by Unemployment Among Youth under 25 years
In terms of unemployment among youth under 25 years, the demographic groups most similar to Puerto Ricans are Navajo (18.6%, a difference of 1.2%), Paiute (17.6%, a difference of 4.8%), Crow (20.1%, a difference of 9.0%), Colville (16.8%, a difference of 9.8%), and Tsimshian (16.5%, a difference of 11.7%).
| Demographics | Rating | Rank | Unemployment Among Youth under 25 years |
| Guyanese | 0.0 /100 | #333 | Tragic 15.9% |
| Immigrants | Guyana | 0.0 /100 | #334 | Tragic 15.9% |
| Immigrants | St. Vincent and the Grenadines | 0.0 /100 | #335 | Tragic 16.1% |
| Pima | 0.0 /100 | #336 | Tragic 16.2% |
| Arapaho | 0.0 /100 | #337 | Tragic 16.3% |
| Yuman | 0.0 /100 | #338 | Tragic 16.3% |
| Tsimshian | 0.0 /100 | #339 | Tragic 16.5% |
| Colville | 0.0 /100 | #340 | Tragic 16.8% |
| Paiute | 0.0 /100 | #341 | Tragic 17.6% |
| Puerto Ricans | 0.0 /100 | #342 | Tragic 18.4% |
| Navajo | 0.0 /100 | #343 | Tragic 18.6% |
| Crow | 0.0 /100 | #344 | Tragic 20.1% |
| Hopi | 0.0 /100 | #345 | Tragic 21.5% |
| Inupiat | 0.0 /100 | #346 | Tragic 22.0% |
| Yup'ik | 0.0 /100 | #347 | Tragic 23.7% |
Demographics Similar to Pakistanis by Unemployment Among Youth under 25 years
In terms of unemployment among youth under 25 years, the demographic groups most similar to Pakistanis are Celtic (11.3%, a difference of 0.0%), Iroquois (11.3%, a difference of 0.020%), Estonian (11.3%, a difference of 0.050%), Nicaraguan (11.3%, a difference of 0.060%), and Immigrants from Thailand (11.3%, a difference of 0.070%).
| Demographics | Rating | Rank | Unemployment Among Youth under 25 years |
| Immigrants | North America | 95.1 /100 | #93 | Exceptional 11.2% |
| Lithuanians | 94.8 /100 | #94 | Exceptional 11.3% |
| Carpatho Rusyns | 94.4 /100 | #95 | Exceptional 11.3% |
| Immigrants | Serbia | 94.4 /100 | #96 | Exceptional 11.3% |
| Nicaraguans | 94.3 /100 | #97 | Exceptional 11.3% |
| Estonians | 94.2 /100 | #98 | Exceptional 11.3% |
| Celtics | 94.0 /100 | #99 | Exceptional 11.3% |
| Pakistanis | 94.0 /100 | #100 | Exceptional 11.3% |
| Iroquois | 93.8 /100 | #101 | Exceptional 11.3% |
| Immigrants | Thailand | 93.6 /100 | #102 | Exceptional 11.3% |
| Immigrants | Malaysia | 93.6 /100 | #103 | Exceptional 11.3% |
| Immigrants | Afghanistan | 93.4 /100 | #104 | Exceptional 11.3% |
| Immigrants | Jordan | 93.1 /100 | #105 | Exceptional 11.3% |
| Chileans | 93.0 /100 | #106 | Exceptional 11.3% |
| Immigrants | Lithuania | 92.9 /100 | #107 | Exceptional 11.3% |