Immigrants from Bangladesh vs Pakistani Single Mother Poverty
COMPARE
Immigrants from Bangladesh
Pakistani
Single Mother Poverty
Single Mother Poverty Comparison
Immigrants from Bangladesh
Pakistanis
31.1%
SINGLE MOTHER POVERTY
0.4/ 100
METRIC RATING
259th/ 347
METRIC RANK
28.0%
SINGLE MOTHER POVERTY
96.9/ 100
METRIC RATING
101st/ 347
METRIC RANK
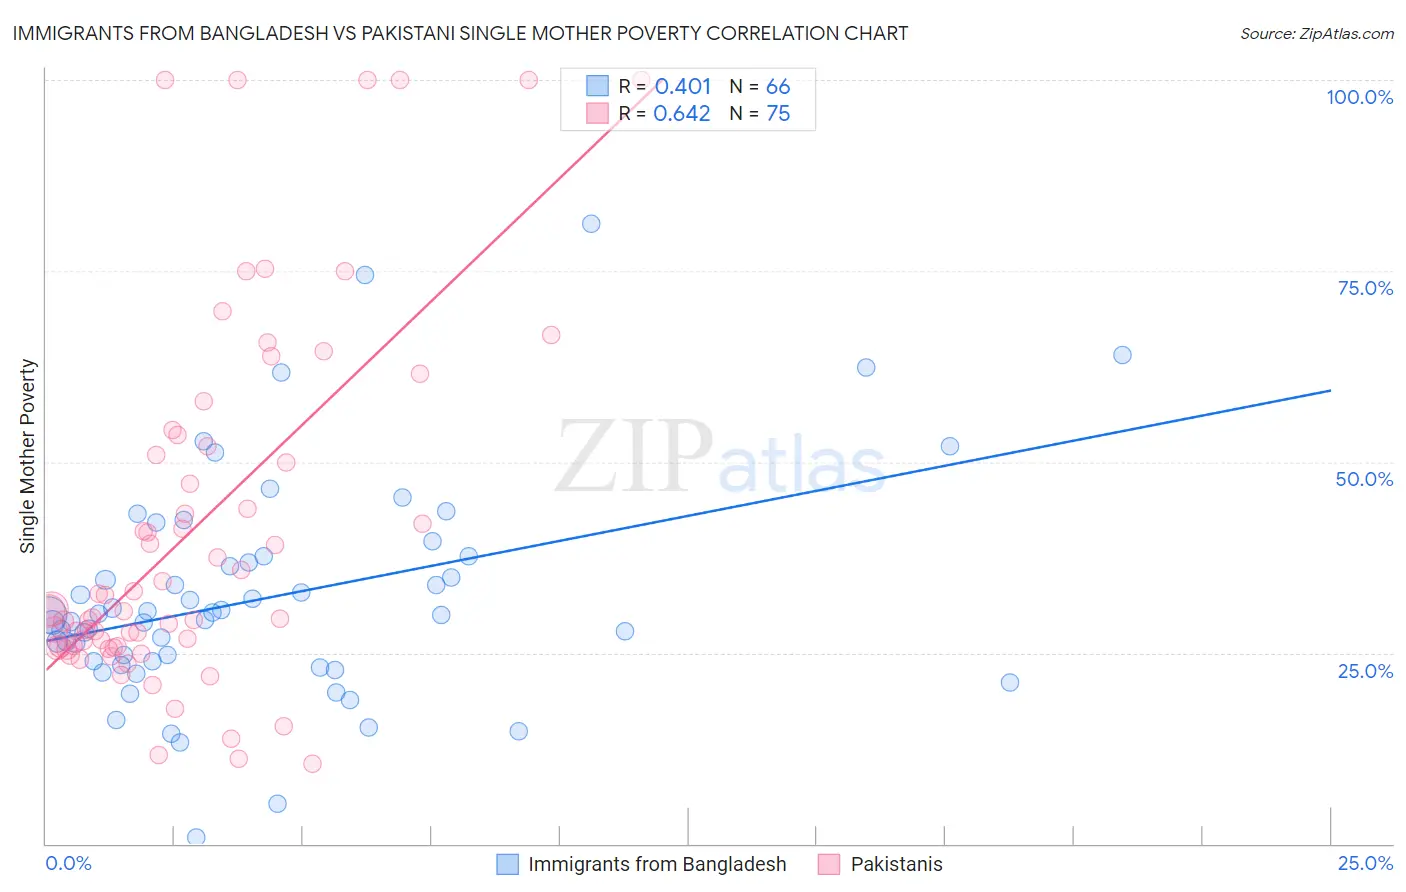
Immigrants from Bangladesh vs Pakistani Single Mother Poverty Correlation Chart
The statistical analysis conducted on geographies consisting of 201,175,153 people shows a moderate positive correlation between the proportion of Immigrants from Bangladesh and poverty level among single mothers in the United States with a correlation coefficient (R) of 0.401 and weighted average of 31.1%. Similarly, the statistical analysis conducted on geographies consisting of 329,467,597 people shows a significant positive correlation between the proportion of Pakistanis and poverty level among single mothers in the United States with a correlation coefficient (R) of 0.642 and weighted average of 28.0%, a difference of 11.3%.
Single Mother Poverty Correlation Summary
| Measurement | Immigrants from Bangladesh | Pakistani |
| Minimum | 0.77% | 10.5% |
| Maximum | 81.2% | 100.0% |
| Range | 80.5% | 89.5% |
| Mean | 32.3% | 41.1% |
| Median | 29.9% | 30.5% |
| Interquartile 25% (IQ1) | 23.8% | 25.8% |
| Interquartile 75% (IQ3) | 37.6% | 52.0% |
| Interquartile Range (IQR) | 13.7% | 26.2% |
| Standard Deviation (Sample) | 14.7% | 23.5% |
| Standard Deviation (Population) | 14.5% | 23.3% |
Similar Demographics by Single Mother Poverty
Demographics Similar to Immigrants from Bangladesh by Single Mother Poverty
In terms of single mother poverty, the demographic groups most similar to Immigrants from Bangladesh are Immigrants from Caribbean (31.1%, a difference of 0.030%), Immigrants from Bahamas (31.1%, a difference of 0.12%), Immigrants from West Indies (31.1%, a difference of 0.16%), White/Caucasian (31.2%, a difference of 0.16%), and Immigrants from El Salvador (31.2%, a difference of 0.23%).
| Demographics | Rating | Rank | Single Mother Poverty |
| Alaska Natives | 0.6 /100 | #252 | Tragic 30.9% |
| Celtics | 0.6 /100 | #253 | Tragic 30.9% |
| Senegalese | 0.5 /100 | #254 | Tragic 31.0% |
| Belizeans | 0.5 /100 | #255 | Tragic 31.0% |
| Immigrants | West Indies | 0.4 /100 | #256 | Tragic 31.1% |
| Immigrants | Bahamas | 0.4 /100 | #257 | Tragic 31.1% |
| Immigrants | Caribbean | 0.4 /100 | #258 | Tragic 31.1% |
| Immigrants | Bangladesh | 0.4 /100 | #259 | Tragic 31.1% |
| Whites/Caucasians | 0.3 /100 | #260 | Tragic 31.2% |
| Immigrants | El Salvador | 0.3 /100 | #261 | Tragic 31.2% |
| Hmong | 0.3 /100 | #262 | Tragic 31.2% |
| Bahamians | 0.2 /100 | #263 | Tragic 31.3% |
| Immigrants | Ecuador | 0.2 /100 | #264 | Tragic 31.3% |
| German Russians | 0.2 /100 | #265 | Tragic 31.3% |
| Sub-Saharan Africans | 0.2 /100 | #266 | Tragic 31.4% |
Demographics Similar to Pakistanis by Single Mother Poverty
In terms of single mother poverty, the demographic groups most similar to Pakistanis are Zimbabwean (27.9%, a difference of 0.070%), Immigrants from Croatia (28.0%, a difference of 0.10%), Immigrants from Netherlands (27.9%, a difference of 0.11%), Immigrants from Nepal (27.9%, a difference of 0.12%), and Immigrants from Northern Africa (28.0%, a difference of 0.12%).
| Demographics | Rating | Rank | Single Mother Poverty |
| Albanians | 97.6 /100 | #94 | Exceptional 27.9% |
| Chileans | 97.5 /100 | #95 | Exceptional 27.9% |
| Immigrants | Iraq | 97.3 /100 | #96 | Exceptional 27.9% |
| Immigrants | Brazil | 97.2 /100 | #97 | Exceptional 27.9% |
| Immigrants | Nepal | 97.2 /100 | #98 | Exceptional 27.9% |
| Immigrants | Netherlands | 97.2 /100 | #99 | Exceptional 27.9% |
| Zimbabweans | 97.1 /100 | #100 | Exceptional 27.9% |
| Pakistanis | 96.9 /100 | #101 | Exceptional 28.0% |
| Immigrants | Croatia | 96.7 /100 | #102 | Exceptional 28.0% |
| Immigrants | Northern Africa | 96.6 /100 | #103 | Exceptional 28.0% |
| Italians | 96.6 /100 | #104 | Exceptional 28.0% |
| Israelis | 96.5 /100 | #105 | Exceptional 28.0% |
| Ukrainians | 96.4 /100 | #106 | Exceptional 28.0% |
| Immigrants | Venezuela | 95.8 /100 | #107 | Exceptional 28.1% |
| Immigrants | Zimbabwe | 95.5 /100 | #108 | Exceptional 28.1% |