Pueblo vs Immigrants from Guyana Single Female Poverty
COMPARE
Pueblo
Immigrants from Guyana
Single Female Poverty
Single Female Poverty Comparison
Pueblo
Immigrants from Guyana
28.6%
SINGLE FEMALE POVERTY
0.0/ 100
METRIC RATING
334th/ 347
METRIC RANK
21.0%
SINGLE FEMALE POVERTY
50.6/ 100
METRIC RATING
173rd/ 347
METRIC RANK
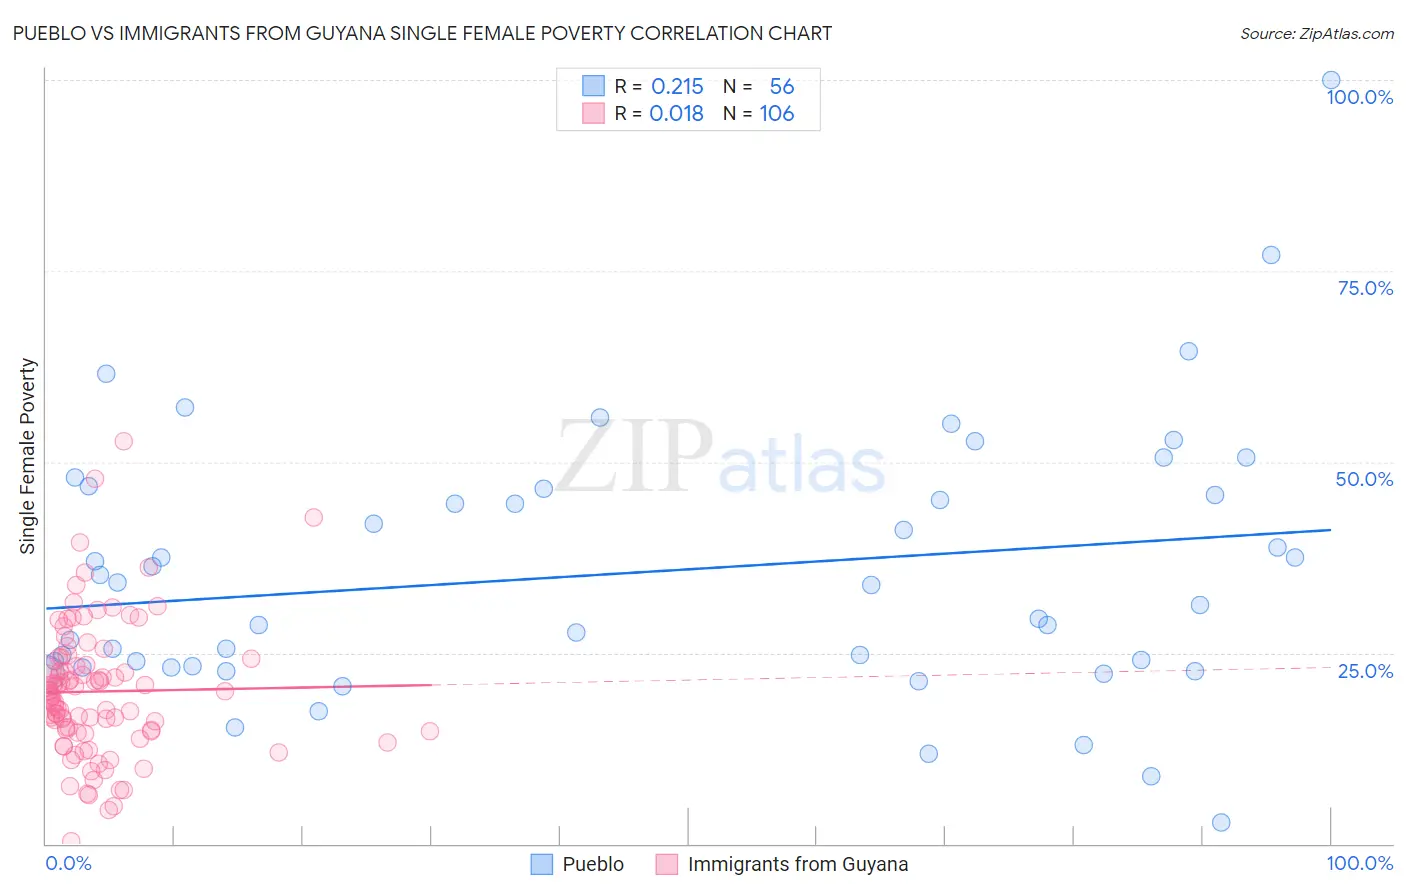
Pueblo vs Immigrants from Guyana Single Female Poverty Correlation Chart
The statistical analysis conducted on geographies consisting of 119,546,041 people shows a weak positive correlation between the proportion of Pueblo and poverty level among single females in the United States with a correlation coefficient (R) of 0.215 and weighted average of 28.6%. Similarly, the statistical analysis conducted on geographies consisting of 182,103,781 people shows no correlation between the proportion of Immigrants from Guyana and poverty level among single females in the United States with a correlation coefficient (R) of 0.018 and weighted average of 21.0%, a difference of 36.3%.
Single Female Poverty Correlation Summary
| Measurement | Pueblo | Immigrants from Guyana |
| Minimum | 2.9% | 0.34% |
| Maximum | 100.0% | 52.6% |
| Range | 97.1% | 52.3% |
| Mean | 35.5% | 19.9% |
| Median | 32.6% | 19.5% |
| Interquartile 25% (IQ1) | 23.2% | 14.8% |
| Interquartile 75% (IQ3) | 46.1% | 23.4% |
| Interquartile Range (IQR) | 22.9% | 8.6% |
| Standard Deviation (Sample) | 17.5% | 8.8% |
| Standard Deviation (Population) | 17.4% | 8.8% |
Similar Demographics by Single Female Poverty
Demographics Similar to Pueblo by Single Female Poverty
In terms of single female poverty, the demographic groups most similar to Pueblo are Ute (28.4%, a difference of 0.73%), Immigrants from Yemen (28.9%, a difference of 1.1%), Yakama (28.3%, a difference of 1.1%), Native/Alaskan (28.2%, a difference of 1.4%), and Colville (29.1%, a difference of 1.6%).
| Demographics | Rating | Rank | Single Female Poverty |
| Dutch West Indians | 0.0 /100 | #327 | Tragic 27.5% |
| Apache | 0.0 /100 | #328 | Tragic 27.7% |
| Menominee | 0.0 /100 | #329 | Tragic 27.8% |
| Hopi | 0.0 /100 | #330 | Tragic 28.0% |
| Natives/Alaskans | 0.0 /100 | #331 | Tragic 28.2% |
| Yakama | 0.0 /100 | #332 | Tragic 28.3% |
| Ute | 0.0 /100 | #333 | Tragic 28.4% |
| Pueblo | 0.0 /100 | #334 | Tragic 28.6% |
| Immigrants | Yemen | 0.0 /100 | #335 | Tragic 28.9% |
| Colville | 0.0 /100 | #336 | Tragic 29.1% |
| Yuman | 0.0 /100 | #337 | Tragic 29.4% |
| Pima | 0.0 /100 | #338 | Tragic 30.3% |
| Cheyenne | 0.0 /100 | #339 | Tragic 30.4% |
| Cajuns | 0.0 /100 | #340 | Tragic 30.6% |
| Sioux | 0.0 /100 | #341 | Tragic 31.3% |
Demographics Similar to Immigrants from Guyana by Single Female Poverty
In terms of single female poverty, the demographic groups most similar to Immigrants from Guyana are Cuban (21.0%, a difference of 0.040%), Guyanese (21.0%, a difference of 0.090%), Moroccan (21.0%, a difference of 0.14%), New Zealander (21.0%, a difference of 0.16%), and Czech (21.0%, a difference of 0.24%).
| Demographics | Rating | Rank | Single Female Poverty |
| Norwegians | 63.0 /100 | #166 | Good 20.8% |
| Immigrants | Norway | 63.0 /100 | #167 | Good 20.8% |
| Immigrants | Costa Rica | 61.5 /100 | #168 | Good 20.9% |
| Immigrants | Trinidad and Tobago | 56.3 /100 | #169 | Average 20.9% |
| New Zealanders | 53.2 /100 | #170 | Average 21.0% |
| Moroccans | 52.8 /100 | #171 | Average 21.0% |
| Guyanese | 52.0 /100 | #172 | Average 21.0% |
| Immigrants | Guyana | 50.6 /100 | #173 | Average 21.0% |
| Cubans | 50.0 /100 | #174 | Average 21.0% |
| Czechs | 46.8 /100 | #175 | Average 21.0% |
| Canadians | 45.4 /100 | #176 | Average 21.1% |
| Scandinavians | 45.2 /100 | #177 | Average 21.1% |
| Immigrants | Bosnia and Herzegovina | 44.9 /100 | #178 | Average 21.1% |
| British | 42.9 /100 | #179 | Average 21.1% |
| Spanish American Indians | 42.5 /100 | #180 | Average 21.1% |