Pueblo vs Immigrants from Honduras Single Female Poverty
COMPARE
Pueblo
Immigrants from Honduras
Single Female Poverty
Single Female Poverty Comparison
Pueblo
Immigrants from Honduras
28.6%
SINGLE FEMALE POVERTY
0.0/ 100
METRIC RATING
334th/ 347
METRIC RANK
25.5%
SINGLE FEMALE POVERTY
0.0/ 100
METRIC RATING
311th/ 347
METRIC RANK
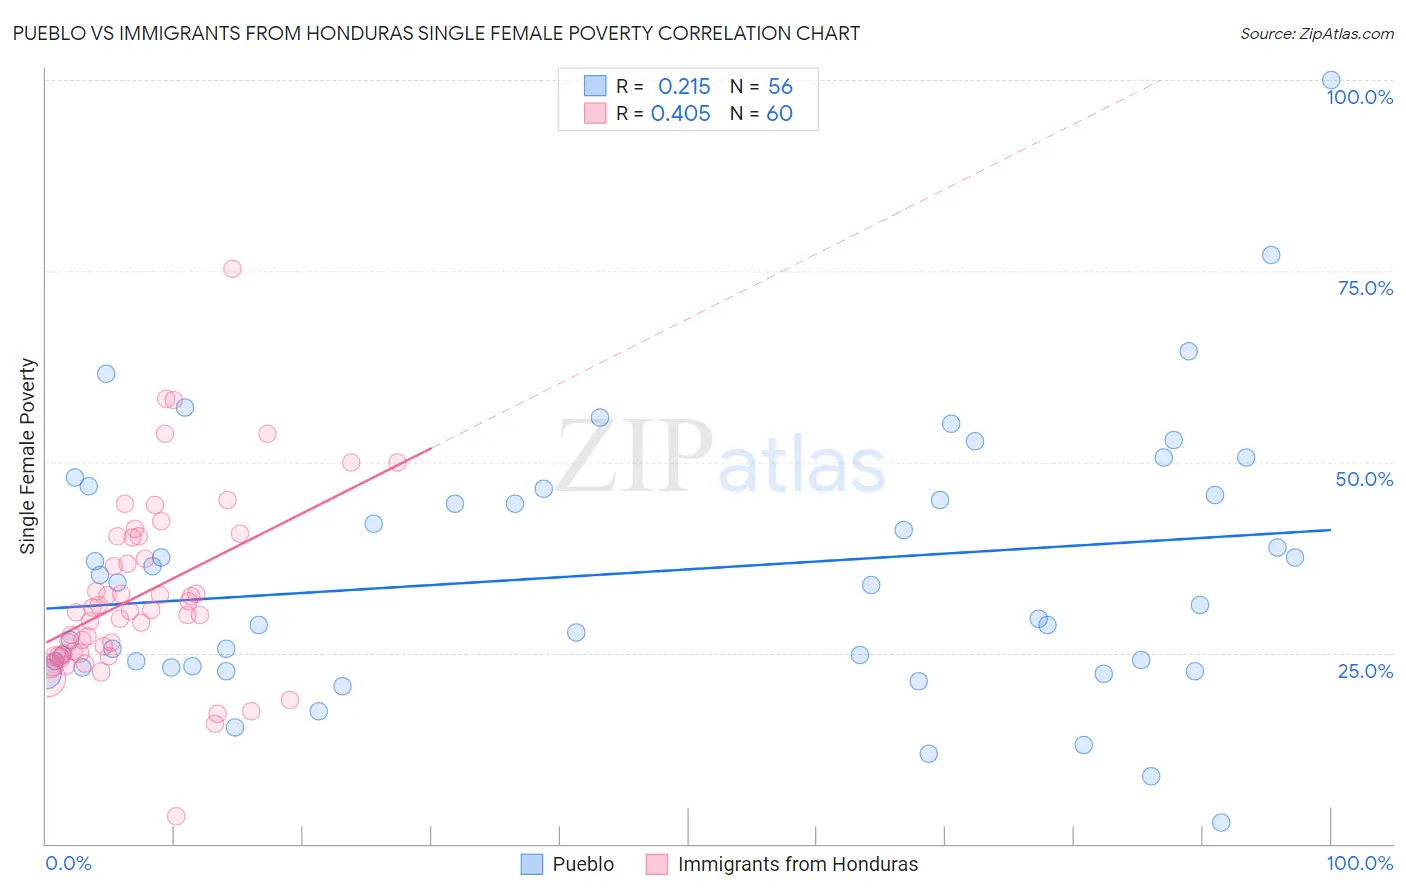
Pueblo vs Immigrants from Honduras Single Female Poverty Correlation Chart
The statistical analysis conducted on geographies consisting of 119,546,041 people shows a weak positive correlation between the proportion of Pueblo and poverty level among single females in the United States with a correlation coefficient (R) of 0.215 and weighted average of 28.6%. Similarly, the statistical analysis conducted on geographies consisting of 320,392,656 people shows a moderate positive correlation between the proportion of Immigrants from Honduras and poverty level among single females in the United States with a correlation coefficient (R) of 0.405 and weighted average of 25.5%, a difference of 12.1%.
Single Female Poverty Correlation Summary
| Measurement | Pueblo | Immigrants from Honduras |
| Minimum | 2.9% | 3.6% |
| Maximum | 100.0% | 75.2% |
| Range | 97.1% | 71.6% |
| Mean | 35.5% | 32.7% |
| Median | 32.6% | 30.4% |
| Interquartile 25% (IQ1) | 23.2% | 24.7% |
| Interquartile 75% (IQ3) | 46.1% | 40.2% |
| Interquartile Range (IQR) | 22.9% | 15.4% |
| Standard Deviation (Sample) | 17.5% | 12.1% |
| Standard Deviation (Population) | 17.4% | 12.0% |
Similar Demographics by Single Female Poverty
Demographics Similar to Pueblo by Single Female Poverty
In terms of single female poverty, the demographic groups most similar to Pueblo are Ute (28.4%, a difference of 0.73%), Immigrants from Yemen (28.9%, a difference of 1.1%), Yakama (28.3%, a difference of 1.1%), Native/Alaskan (28.2%, a difference of 1.4%), and Colville (29.1%, a difference of 1.6%).
| Demographics | Rating | Rank | Single Female Poverty |
| Dutch West Indians | 0.0 /100 | #327 | Tragic 27.5% |
| Apache | 0.0 /100 | #328 | Tragic 27.7% |
| Menominee | 0.0 /100 | #329 | Tragic 27.8% |
| Hopi | 0.0 /100 | #330 | Tragic 28.0% |
| Natives/Alaskans | 0.0 /100 | #331 | Tragic 28.2% |
| Yakama | 0.0 /100 | #332 | Tragic 28.3% |
| Ute | 0.0 /100 | #333 | Tragic 28.4% |
| Pueblo | 0.0 /100 | #334 | Tragic 28.6% |
| Immigrants | Yemen | 0.0 /100 | #335 | Tragic 28.9% |
| Colville | 0.0 /100 | #336 | Tragic 29.1% |
| Yuman | 0.0 /100 | #337 | Tragic 29.4% |
| Pima | 0.0 /100 | #338 | Tragic 30.3% |
| Cheyenne | 0.0 /100 | #339 | Tragic 30.4% |
| Cajuns | 0.0 /100 | #340 | Tragic 30.6% |
| Sioux | 0.0 /100 | #341 | Tragic 31.3% |
Demographics Similar to Immigrants from Honduras by Single Female Poverty
In terms of single female poverty, the demographic groups most similar to Immigrants from Honduras are Paiute (25.5%, a difference of 0.050%), Comanche (25.6%, a difference of 0.16%), Central American Indian (25.5%, a difference of 0.28%), Dominican (25.4%, a difference of 0.43%), and Aleut (25.4%, a difference of 0.44%).
| Demographics | Rating | Rank | Single Female Poverty |
| Immigrants | Congo | 0.0 /100 | #304 | Tragic 25.3% |
| Immigrants | Dominican Republic | 0.0 /100 | #305 | Tragic 25.3% |
| Immigrants | Mexico | 0.0 /100 | #306 | Tragic 25.3% |
| Potawatomi | 0.0 /100 | #307 | Tragic 25.4% |
| Aleuts | 0.0 /100 | #308 | Tragic 25.4% |
| Dominicans | 0.0 /100 | #309 | Tragic 25.4% |
| Central American Indians | 0.0 /100 | #310 | Tragic 25.5% |
| Immigrants | Honduras | 0.0 /100 | #311 | Tragic 25.5% |
| Paiute | 0.0 /100 | #312 | Tragic 25.5% |
| Comanche | 0.0 /100 | #313 | Tragic 25.6% |
| Cherokee | 0.0 /100 | #314 | Tragic 25.7% |
| Iroquois | 0.0 /100 | #315 | Tragic 25.7% |
| Immigrants | Somalia | 0.0 /100 | #316 | Tragic 25.8% |
| Ottawa | 0.0 /100 | #317 | Tragic 26.0% |
| Chickasaw | 0.0 /100 | #318 | Tragic 26.3% |