U.S. Virgin Islander vs Immigrants from Guyana Single Female Poverty
COMPARE
U.S. Virgin Islander
Immigrants from Guyana
Single Female Poverty
Single Female Poverty Comparison
U.S. Virgin Islanders
Immigrants from Guyana
24.2%
SINGLE FEMALE POVERTY
0.0/ 100
METRIC RATING
289th/ 347
METRIC RANK
21.0%
SINGLE FEMALE POVERTY
50.6/ 100
METRIC RATING
173rd/ 347
METRIC RANK
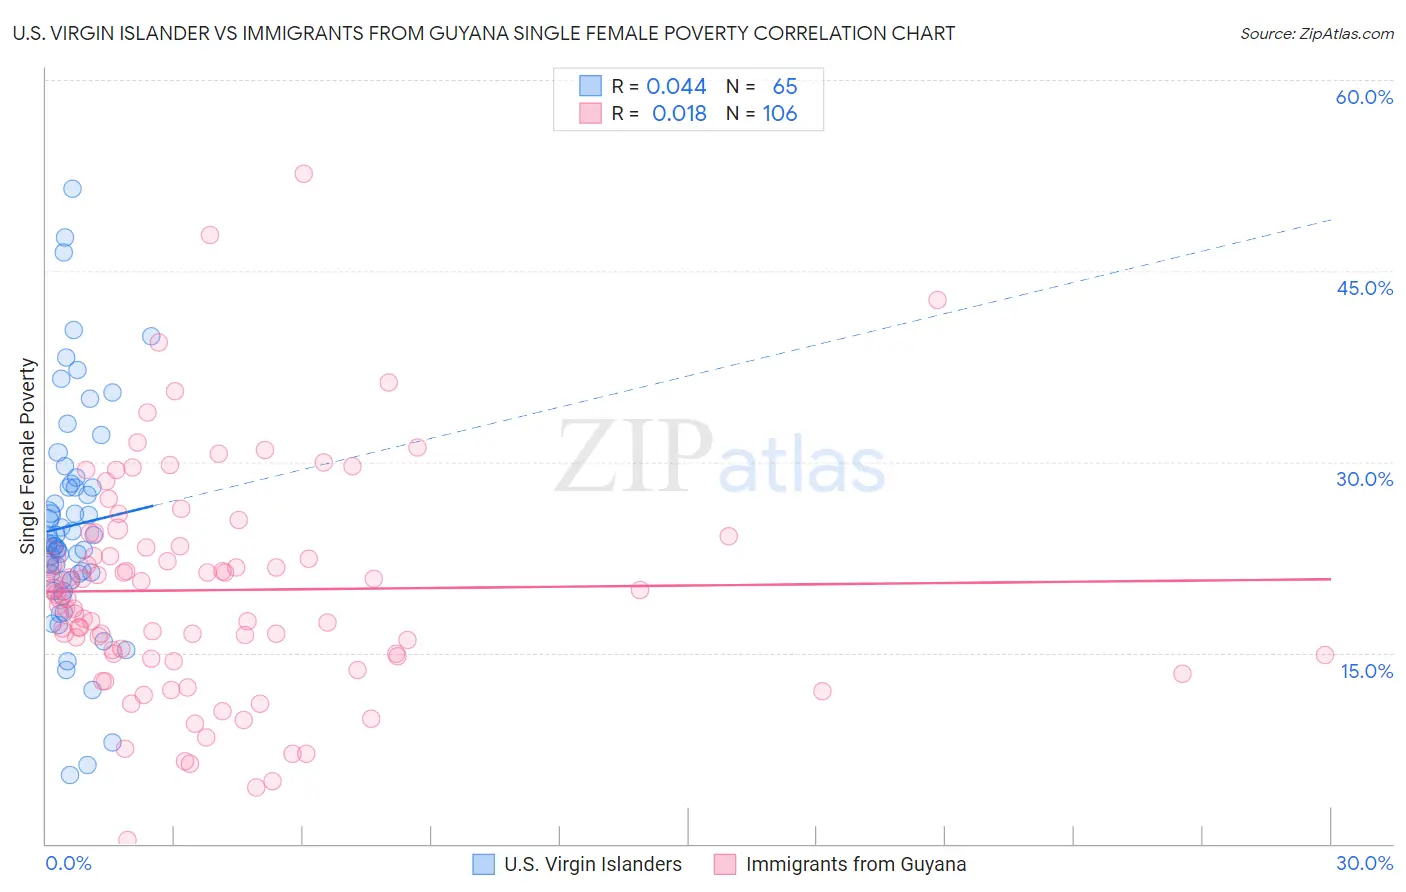
U.S. Virgin Islander vs Immigrants from Guyana Single Female Poverty Correlation Chart
The statistical analysis conducted on geographies consisting of 87,304,073 people shows no correlation between the proportion of U.S. Virgin Islanders and poverty level among single females in the United States with a correlation coefficient (R) of 0.044 and weighted average of 24.2%. Similarly, the statistical analysis conducted on geographies consisting of 182,103,781 people shows no correlation between the proportion of Immigrants from Guyana and poverty level among single females in the United States with a correlation coefficient (R) of 0.018 and weighted average of 21.0%, a difference of 15.1%.
Single Female Poverty Correlation Summary
| Measurement | U.S. Virgin Islander | Immigrants from Guyana |
| Minimum | 5.4% | 0.34% |
| Maximum | 51.4% | 52.6% |
| Range | 46.0% | 52.3% |
| Mean | 25.0% | 19.9% |
| Median | 23.5% | 19.5% |
| Interquartile 25% (IQ1) | 20.7% | 14.8% |
| Interquartile 75% (IQ3) | 28.2% | 23.4% |
| Interquartile Range (IQR) | 7.5% | 8.6% |
| Standard Deviation (Sample) | 8.9% | 8.8% |
| Standard Deviation (Population) | 8.9% | 8.8% |
Similar Demographics by Single Female Poverty
Demographics Similar to U.S. Virgin Islanders by Single Female Poverty
In terms of single female poverty, the demographic groups most similar to U.S. Virgin Islanders are Spanish American (24.2%, a difference of 0.050%), Bangladeshi (24.2%, a difference of 0.070%), Cree (24.1%, a difference of 0.22%), Immigrants from Guatemala (24.1%, a difference of 0.26%), and Indonesian (24.3%, a difference of 0.34%).
| Demographics | Rating | Rank | Single Female Poverty |
| Guatemalans | 0.0 /100 | #282 | Tragic 23.8% |
| German Russians | 0.0 /100 | #283 | Tragic 23.9% |
| Immigrants | Dominica | 0.0 /100 | #284 | Tragic 23.9% |
| Immigrants | Guatemala | 0.0 /100 | #285 | Tragic 24.1% |
| Cree | 0.0 /100 | #286 | Tragic 24.1% |
| Bangladeshis | 0.0 /100 | #287 | Tragic 24.2% |
| Spanish Americans | 0.0 /100 | #288 | Tragic 24.2% |
| U.S. Virgin Islanders | 0.0 /100 | #289 | Tragic 24.2% |
| Indonesians | 0.0 /100 | #290 | Tragic 24.3% |
| Osage | 0.0 /100 | #291 | Tragic 24.4% |
| Alsatians | 0.0 /100 | #292 | Tragic 24.5% |
| Americans | 0.0 /100 | #293 | Tragic 24.5% |
| French American Indians | 0.0 /100 | #294 | Tragic 24.6% |
| Hispanics or Latinos | 0.0 /100 | #295 | Tragic 24.6% |
| Africans | 0.0 /100 | #296 | Tragic 24.8% |
Demographics Similar to Immigrants from Guyana by Single Female Poverty
In terms of single female poverty, the demographic groups most similar to Immigrants from Guyana are Cuban (21.0%, a difference of 0.040%), Guyanese (21.0%, a difference of 0.090%), Moroccan (21.0%, a difference of 0.14%), New Zealander (21.0%, a difference of 0.16%), and Czech (21.0%, a difference of 0.24%).
| Demographics | Rating | Rank | Single Female Poverty |
| Norwegians | 63.0 /100 | #166 | Good 20.8% |
| Immigrants | Norway | 63.0 /100 | #167 | Good 20.8% |
| Immigrants | Costa Rica | 61.5 /100 | #168 | Good 20.9% |
| Immigrants | Trinidad and Tobago | 56.3 /100 | #169 | Average 20.9% |
| New Zealanders | 53.2 /100 | #170 | Average 21.0% |
| Moroccans | 52.8 /100 | #171 | Average 21.0% |
| Guyanese | 52.0 /100 | #172 | Average 21.0% |
| Immigrants | Guyana | 50.6 /100 | #173 | Average 21.0% |
| Cubans | 50.0 /100 | #174 | Average 21.0% |
| Czechs | 46.8 /100 | #175 | Average 21.0% |
| Canadians | 45.4 /100 | #176 | Average 21.1% |
| Scandinavians | 45.2 /100 | #177 | Average 21.1% |
| Immigrants | Bosnia and Herzegovina | 44.9 /100 | #178 | Average 21.1% |
| British | 42.9 /100 | #179 | Average 21.1% |
| Spanish American Indians | 42.5 /100 | #180 | Average 21.1% |