Immigrants from Pakistan vs Immigrants from Guyana Single Female Poverty
COMPARE
Immigrants from Pakistan
Immigrants from Guyana
Single Female Poverty
Single Female Poverty Comparison
Immigrants from Pakistan
Immigrants from Guyana
18.4%
SINGLE FEMALE POVERTY
100.0/ 100
METRIC RATING
27th/ 347
METRIC RANK
21.0%
SINGLE FEMALE POVERTY
50.6/ 100
METRIC RATING
173rd/ 347
METRIC RANK
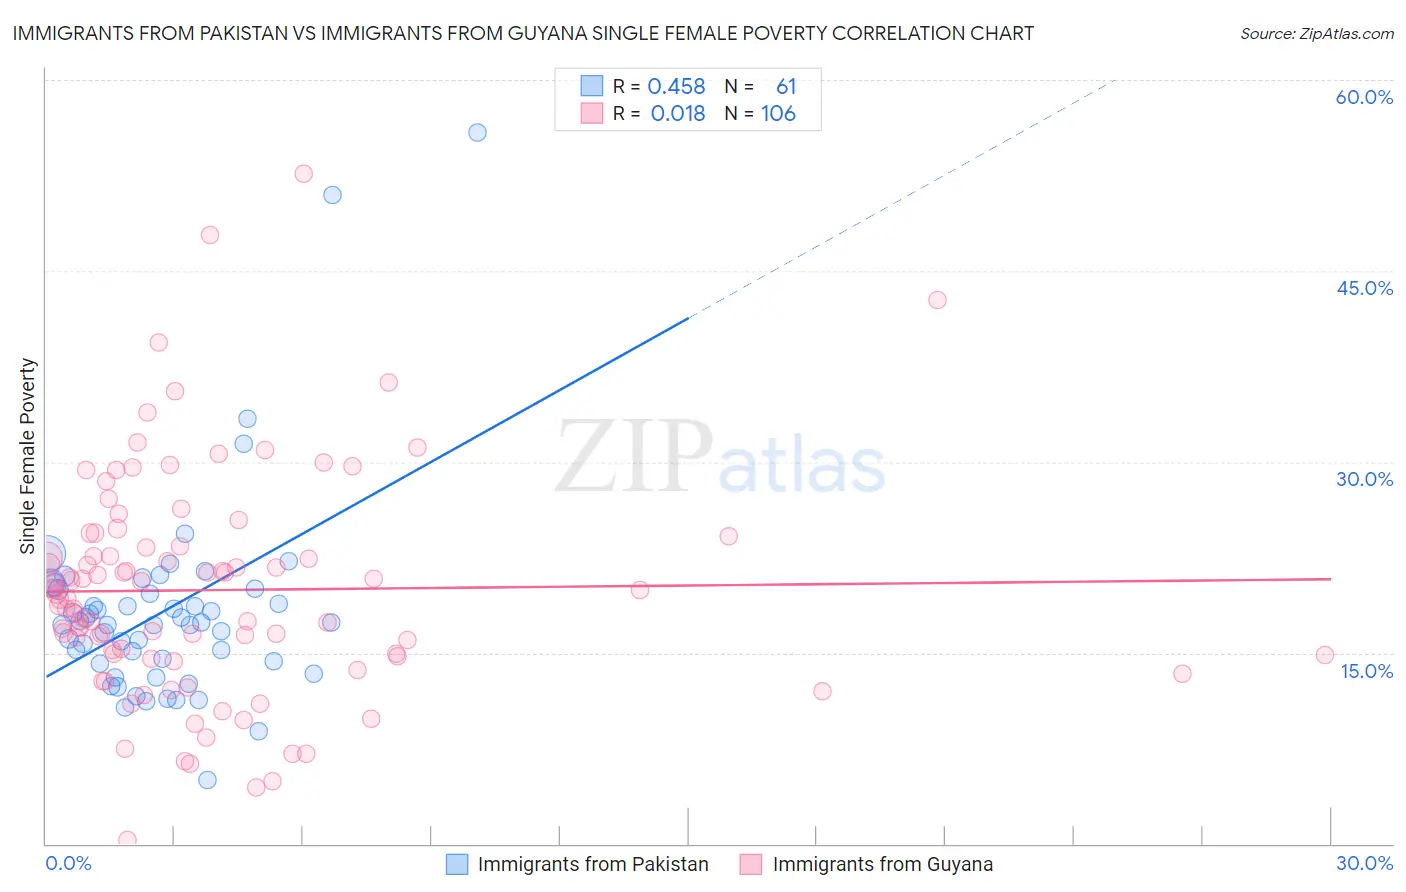
Immigrants from Pakistan vs Immigrants from Guyana Single Female Poverty Correlation Chart
The statistical analysis conducted on geographies consisting of 280,684,274 people shows a moderate positive correlation between the proportion of Immigrants from Pakistan and poverty level among single females in the United States with a correlation coefficient (R) of 0.458 and weighted average of 18.4%. Similarly, the statistical analysis conducted on geographies consisting of 182,103,781 people shows no correlation between the proportion of Immigrants from Guyana and poverty level among single females in the United States with a correlation coefficient (R) of 0.018 and weighted average of 21.0%, a difference of 14.1%.
Single Female Poverty Correlation Summary
| Measurement | Immigrants from Pakistan | Immigrants from Guyana |
| Minimum | 5.1% | 0.34% |
| Maximum | 55.9% | 52.6% |
| Range | 50.9% | 52.3% |
| Mean | 18.3% | 19.9% |
| Median | 17.3% | 19.5% |
| Interquartile 25% (IQ1) | 14.2% | 14.8% |
| Interquartile 75% (IQ3) | 20.0% | 23.4% |
| Interquartile Range (IQR) | 5.8% | 8.6% |
| Standard Deviation (Sample) | 8.0% | 8.8% |
| Standard Deviation (Population) | 8.0% | 8.8% |
Similar Demographics by Single Female Poverty
Demographics Similar to Immigrants from Pakistan by Single Female Poverty
In terms of single female poverty, the demographic groups most similar to Immigrants from Pakistan are Immigrants from Israel (18.3%, a difference of 0.33%), Immigrants from Singapore (18.3%, a difference of 0.36%), Armenian (18.3%, a difference of 0.46%), Immigrants from Moldova (18.5%, a difference of 0.49%), and Immigrants from Poland (18.5%, a difference of 0.59%).
| Demographics | Rating | Rank | Single Female Poverty |
| Immigrants | Greece | 100.0 /100 | #20 | Exceptional 18.3% |
| Maltese | 100.0 /100 | #21 | Exceptional 18.3% |
| Burmese | 100.0 /100 | #22 | Exceptional 18.3% |
| Asians | 100.0 /100 | #23 | Exceptional 18.3% |
| Armenians | 100.0 /100 | #24 | Exceptional 18.3% |
| Immigrants | Singapore | 100.0 /100 | #25 | Exceptional 18.3% |
| Immigrants | Israel | 100.0 /100 | #26 | Exceptional 18.3% |
| Immigrants | Pakistan | 100.0 /100 | #27 | Exceptional 18.4% |
| Immigrants | Moldova | 100.0 /100 | #28 | Exceptional 18.5% |
| Immigrants | Poland | 100.0 /100 | #29 | Exceptional 18.5% |
| Immigrants | North Macedonia | 99.9 /100 | #30 | Exceptional 18.5% |
| Immigrants | Asia | 99.9 /100 | #31 | Exceptional 18.6% |
| Immigrants | Sri Lanka | 99.9 /100 | #32 | Exceptional 18.6% |
| Immigrants | Philippines | 99.9 /100 | #33 | Exceptional 18.6% |
| Koreans | 99.9 /100 | #34 | Exceptional 18.6% |
Demographics Similar to Immigrants from Guyana by Single Female Poverty
In terms of single female poverty, the demographic groups most similar to Immigrants from Guyana are Cuban (21.0%, a difference of 0.040%), Guyanese (21.0%, a difference of 0.090%), Moroccan (21.0%, a difference of 0.14%), New Zealander (21.0%, a difference of 0.16%), and Czech (21.0%, a difference of 0.24%).
| Demographics | Rating | Rank | Single Female Poverty |
| Norwegians | 63.0 /100 | #166 | Good 20.8% |
| Immigrants | Norway | 63.0 /100 | #167 | Good 20.8% |
| Immigrants | Costa Rica | 61.5 /100 | #168 | Good 20.9% |
| Immigrants | Trinidad and Tobago | 56.3 /100 | #169 | Average 20.9% |
| New Zealanders | 53.2 /100 | #170 | Average 21.0% |
| Moroccans | 52.8 /100 | #171 | Average 21.0% |
| Guyanese | 52.0 /100 | #172 | Average 21.0% |
| Immigrants | Guyana | 50.6 /100 | #173 | Average 21.0% |
| Cubans | 50.0 /100 | #174 | Average 21.0% |
| Czechs | 46.8 /100 | #175 | Average 21.0% |
| Canadians | 45.4 /100 | #176 | Average 21.1% |
| Scandinavians | 45.2 /100 | #177 | Average 21.1% |
| Immigrants | Bosnia and Herzegovina | 44.9 /100 | #178 | Average 21.1% |
| British | 42.9 /100 | #179 | Average 21.1% |
| Spanish American Indians | 42.5 /100 | #180 | Average 21.1% |