Danish vs Immigrants from Latvia Single Female Poverty
COMPARE
Danish
Immigrants from Latvia
Single Female Poverty
Single Female Poverty Comparison
Danes
Immigrants from Latvia
20.7%
SINGLE FEMALE POVERTY
73.0/ 100
METRIC RATING
158th/ 347
METRIC RANK
19.3%
SINGLE FEMALE POVERTY
99.4/ 100
METRIC RATING
72nd/ 347
METRIC RANK
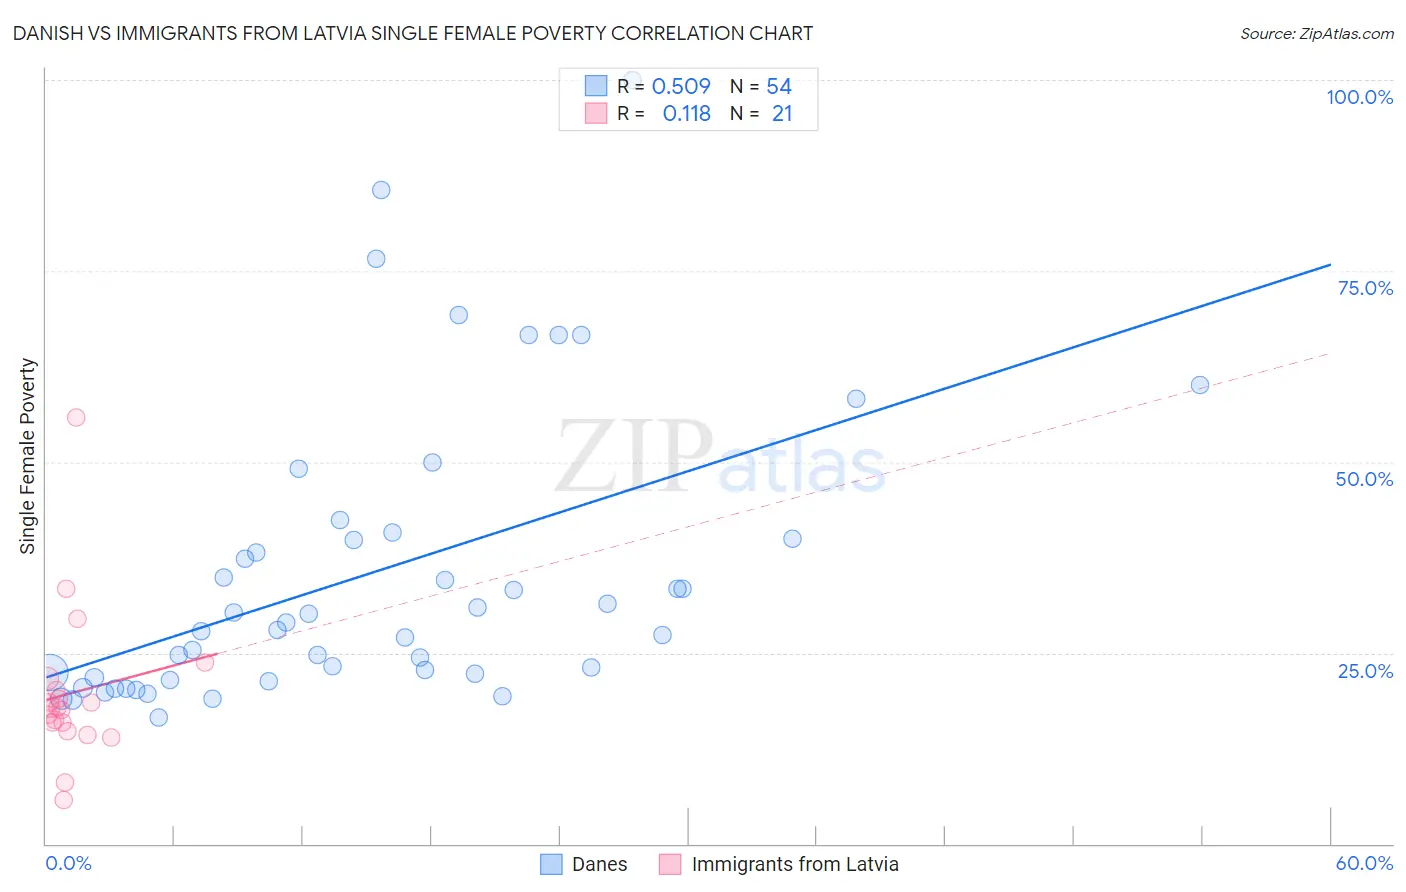
Danish vs Immigrants from Latvia Single Female Poverty Correlation Chart
The statistical analysis conducted on geographies consisting of 461,634,769 people shows a substantial positive correlation between the proportion of Danes and poverty level among single females in the United States with a correlation coefficient (R) of 0.509 and weighted average of 20.7%. Similarly, the statistical analysis conducted on geographies consisting of 112,952,917 people shows a poor positive correlation between the proportion of Immigrants from Latvia and poverty level among single females in the United States with a correlation coefficient (R) of 0.118 and weighted average of 19.3%, a difference of 7.0%.
Single Female Poverty Correlation Summary
| Measurement | Danish | Immigrants from Latvia |
| Minimum | 16.6% | 5.7% |
| Maximum | 100.0% | 55.9% |
| Range | 83.4% | 50.1% |
| Mean | 35.4% | 19.7% |
| Median | 28.5% | 17.6% |
| Interquartile 25% (IQ1) | 21.7% | 15.3% |
| Interquartile 75% (IQ3) | 40.0% | 20.9% |
| Interquartile Range (IQR) | 18.3% | 5.6% |
| Standard Deviation (Sample) | 19.0% | 10.2% |
| Standard Deviation (Population) | 18.8% | 10.0% |
Similar Demographics by Single Female Poverty
Demographics Similar to Danes by Single Female Poverty
In terms of single female poverty, the demographic groups most similar to Danes are Costa Rican (20.7%, a difference of 0.090%), Immigrants from Oceania (20.7%, a difference of 0.11%), Arab (20.7%, a difference of 0.17%), South American Indian (20.6%, a difference of 0.22%), and Samoan (20.6%, a difference of 0.26%).
| Demographics | Rating | Rank | Single Female Poverty |
| Puget Sound Salish | 79.6 /100 | #151 | Good 20.6% |
| Immigrants | Uruguay | 77.7 /100 | #152 | Good 20.6% |
| Swedes | 77.1 /100 | #153 | Good 20.6% |
| Immigrants | Western Europe | 76.7 /100 | #154 | Good 20.6% |
| Samoans | 76.0 /100 | #155 | Good 20.6% |
| South American Indians | 75.7 /100 | #156 | Good 20.6% |
| Immigrants | Oceania | 74.3 /100 | #157 | Good 20.7% |
| Danes | 73.0 /100 | #158 | Good 20.7% |
| Costa Ricans | 71.8 /100 | #159 | Good 20.7% |
| Arabs | 70.8 /100 | #160 | Good 20.7% |
| Kenyans | 68.5 /100 | #161 | Good 20.8% |
| Northern Europeans | 68.4 /100 | #162 | Good 20.8% |
| Lebanese | 67.6 /100 | #163 | Good 20.8% |
| Iraqis | 64.5 /100 | #164 | Good 20.8% |
| Ugandans | 64.0 /100 | #165 | Good 20.8% |
Demographics Similar to Immigrants from Latvia by Single Female Poverty
In terms of single female poverty, the demographic groups most similar to Immigrants from Latvia are Immigrants from South Eastern Asia (19.3%, a difference of 0.0%), Immigrants from Jordan (19.3%, a difference of 0.070%), Immigrants from Peru (19.3%, a difference of 0.10%), Immigrants from Belarus (19.3%, a difference of 0.11%), and Paraguayan (19.3%, a difference of 0.14%).
| Demographics | Rating | Rank | Single Female Poverty |
| Cypriots | 99.6 /100 | #65 | Exceptional 19.2% |
| Palestinians | 99.6 /100 | #66 | Exceptional 19.2% |
| Immigrants | Egypt | 99.6 /100 | #67 | Exceptional 19.2% |
| Laotians | 99.5 /100 | #68 | Exceptional 19.3% |
| Paraguayans | 99.5 /100 | #69 | Exceptional 19.3% |
| Immigrants | Jordan | 99.4 /100 | #70 | Exceptional 19.3% |
| Immigrants | South Eastern Asia | 99.4 /100 | #71 | Exceptional 19.3% |
| Immigrants | Latvia | 99.4 /100 | #72 | Exceptional 19.3% |
| Immigrants | Peru | 99.4 /100 | #73 | Exceptional 19.3% |
| Immigrants | Belarus | 99.4 /100 | #74 | Exceptional 19.3% |
| Immigrants | Turkey | 99.4 /100 | #75 | Exceptional 19.4% |
| Peruvians | 99.4 /100 | #76 | Exceptional 19.4% |
| Immigrants | Russia | 99.3 /100 | #77 | Exceptional 19.4% |
| Albanians | 99.3 /100 | #78 | Exceptional 19.4% |
| Immigrants | Sierra Leone | 99.3 /100 | #79 | Exceptional 19.4% |