Paraguayan vs Immigrants from Latvia 1st Grade
COMPARE
Paraguayan
Immigrants from Latvia
1st Grade
1st Grade Comparison
Paraguayans
Immigrants from Latvia
97.9%
1ST GRADE
30.2/ 100
METRIC RATING
192nd/ 347
METRIC RANK
98.2%
1ST GRADE
96.4/ 100
METRIC RATING
113th/ 347
METRIC RANK
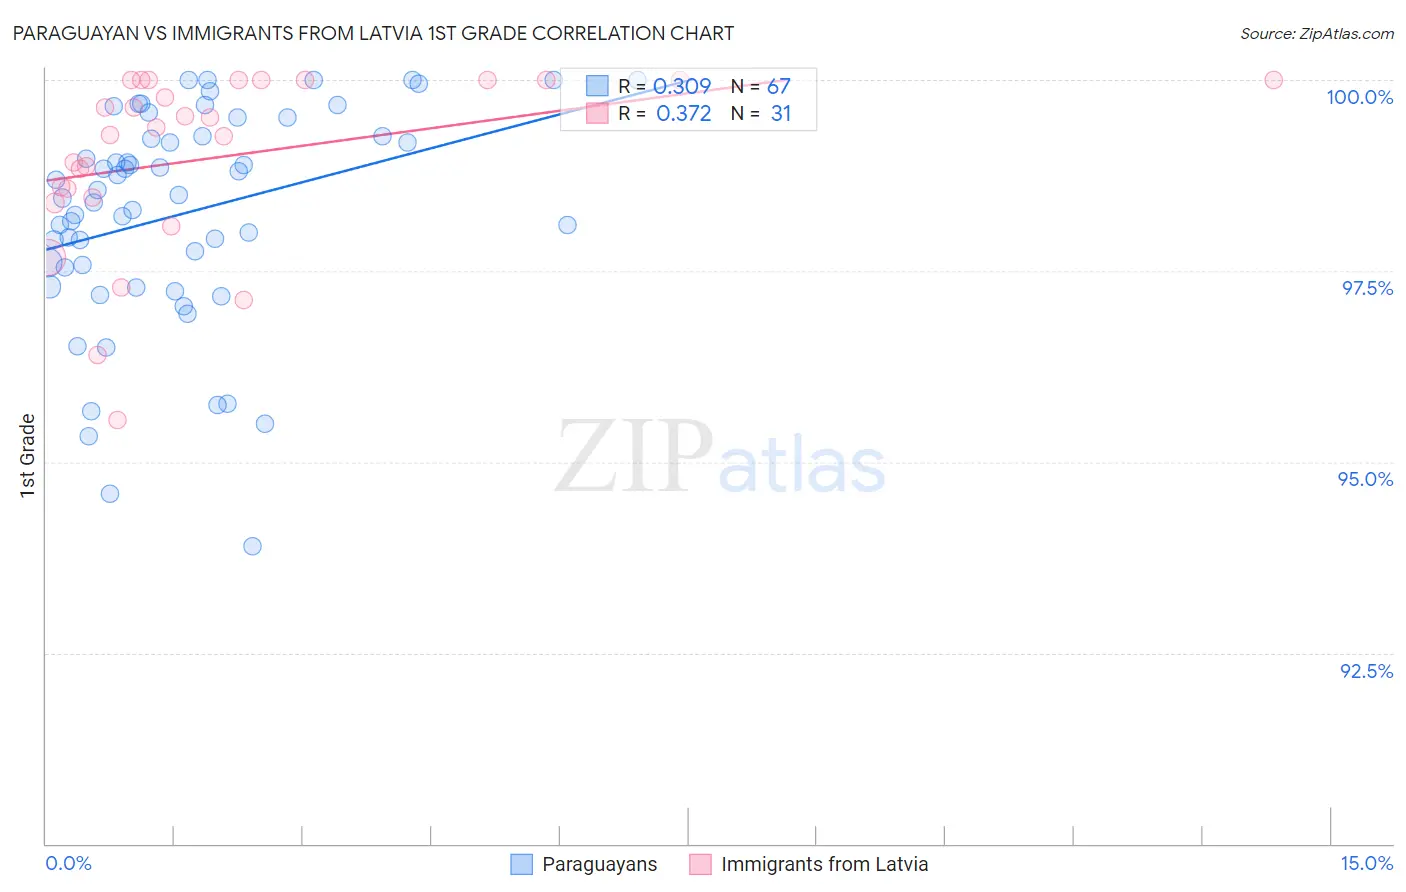
Paraguayan vs Immigrants from Latvia 1st Grade Correlation Chart
The statistical analysis conducted on geographies consisting of 95,114,918 people shows a mild positive correlation between the proportion of Paraguayans and percentage of population with at least 1st grade education in the United States with a correlation coefficient (R) of 0.309 and weighted average of 97.9%. Similarly, the statistical analysis conducted on geographies consisting of 113,735,345 people shows a mild positive correlation between the proportion of Immigrants from Latvia and percentage of population with at least 1st grade education in the United States with a correlation coefficient (R) of 0.372 and weighted average of 98.2%, a difference of 0.32%.
1st Grade Correlation Summary
| Measurement | Paraguayan | Immigrants from Latvia |
| Minimum | 93.9% | 95.5% |
| Maximum | 100.0% | 100.0% |
| Range | 6.1% | 4.5% |
| Mean | 98.3% | 99.0% |
| Median | 98.5% | 99.4% |
| Interquartile 25% (IQ1) | 97.5% | 98.5% |
| Interquartile 75% (IQ3) | 99.3% | 100.0% |
| Interquartile Range (IQR) | 1.7% | 1.5% |
| Standard Deviation (Sample) | 1.4% | 1.2% |
| Standard Deviation (Population) | 1.4% | 1.2% |
Similar Demographics by 1st Grade
Demographics Similar to Paraguayans by 1st Grade
In terms of 1st grade, the demographic groups most similar to Paraguayans are Black/African American (97.9%, a difference of 0.0%), Immigrants from Taiwan (97.9%, a difference of 0.0%), Mongolian (97.9%, a difference of 0.0%), Panamanian (97.9%, a difference of 0.010%), and Hawaiian (97.9%, a difference of 0.010%).
| Demographics | Rating | Rank | 1st Grade |
| Immigrants | Belarus | 39.3 /100 | #185 | Fair 97.9% |
| Paiute | 36.5 /100 | #186 | Fair 97.9% |
| Pakistanis | 35.8 /100 | #187 | Fair 97.9% |
| Arabs | 35.5 /100 | #188 | Fair 97.9% |
| Immigrants | Kazakhstan | 34.9 /100 | #189 | Fair 97.9% |
| Panamanians | 34.1 /100 | #190 | Fair 97.9% |
| Blacks/African Americans | 30.7 /100 | #191 | Fair 97.9% |
| Paraguayans | 30.2 /100 | #192 | Fair 97.9% |
| Immigrants | Taiwan | 29.4 /100 | #193 | Fair 97.9% |
| Mongolians | 29.2 /100 | #194 | Fair 97.9% |
| Hawaiians | 28.8 /100 | #195 | Fair 97.9% |
| Immigrants | Kenya | 26.3 /100 | #196 | Fair 97.8% |
| Guamanians/Chamorros | 26.2 /100 | #197 | Fair 97.8% |
| Yuman | 24.4 /100 | #198 | Fair 97.8% |
| Tohono O'odham | 23.2 /100 | #199 | Fair 97.8% |
Demographics Similar to Immigrants from Latvia by 1st Grade
In terms of 1st grade, the demographic groups most similar to Immigrants from Latvia are Immigrants from Norway (98.2%, a difference of 0.0%), Ute (98.2%, a difference of 0.0%), Immigrants from Singapore (98.2%, a difference of 0.010%), Immigrants from Czechoslovakia (98.2%, a difference of 0.010%), and Iranian (98.2%, a difference of 0.010%).
| Demographics | Rating | Rank | 1st Grade |
| Turks | 97.4 /100 | #106 | Exceptional 98.2% |
| Immigrants | Switzerland | 97.3 /100 | #107 | Exceptional 98.2% |
| Bhutanese | 97.3 /100 | #108 | Exceptional 98.2% |
| German Russians | 97.1 /100 | #109 | Exceptional 98.2% |
| Immigrants | Singapore | 96.7 /100 | #110 | Exceptional 98.2% |
| Immigrants | Czechoslovakia | 96.6 /100 | #111 | Exceptional 98.2% |
| Immigrants | Norway | 96.6 /100 | #112 | Exceptional 98.2% |
| Immigrants | Latvia | 96.4 /100 | #113 | Exceptional 98.2% |
| Ute | 96.2 /100 | #114 | Exceptional 98.2% |
| Iranians | 96.0 /100 | #115 | Exceptional 98.2% |
| Spanish | 95.9 /100 | #116 | Exceptional 98.2% |
| Yugoslavians | 95.5 /100 | #117 | Exceptional 98.2% |
| Immigrants | France | 95.5 /100 | #118 | Exceptional 98.2% |
| Thais | 94.7 /100 | #119 | Exceptional 98.1% |
| Okinawans | 94.5 /100 | #120 | Exceptional 98.1% |