Pakistani vs Immigrants from Denmark Single Male Poverty
COMPARE
Pakistani
Immigrants from Denmark
Single Male Poverty
Single Male Poverty Comparison
Pakistanis
Immigrants from Denmark
12.4%
SINGLE MALE POVERTY
92.4/ 100
METRIC RATING
113th/ 347
METRIC RANK
13.2%
SINGLE MALE POVERTY
8.7/ 100
METRIC RATING
225th/ 347
METRIC RANK
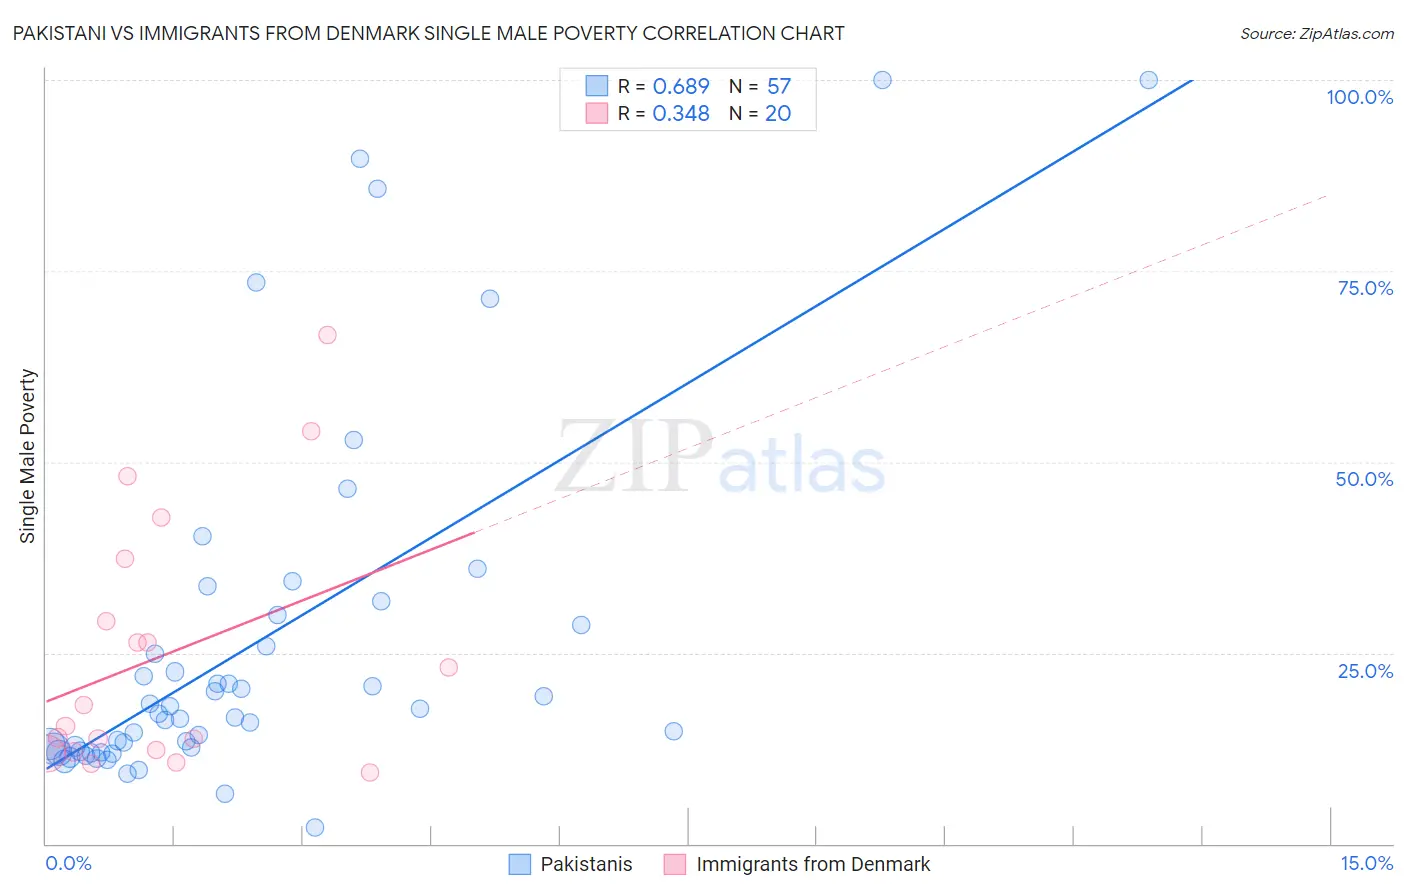
Pakistani vs Immigrants from Denmark Single Male Poverty Correlation Chart
The statistical analysis conducted on geographies consisting of 304,084,454 people shows a significant positive correlation between the proportion of Pakistanis and poverty level among single males in the United States with a correlation coefficient (R) of 0.689 and weighted average of 12.4%. Similarly, the statistical analysis conducted on geographies consisting of 127,193,703 people shows a mild positive correlation between the proportion of Immigrants from Denmark and poverty level among single males in the United States with a correlation coefficient (R) of 0.348 and weighted average of 13.2%, a difference of 6.6%.
Single Male Poverty Correlation Summary
| Measurement | Pakistani | Immigrants from Denmark |
| Minimum | 2.1% | 9.3% |
| Maximum | 100.0% | 66.7% |
| Range | 97.9% | 57.4% |
| Mean | 26.1% | 24.8% |
| Median | 17.0% | 16.8% |
| Interquartile 25% (IQ1) | 12.3% | 12.2% |
| Interquartile 75% (IQ3) | 29.3% | 33.2% |
| Interquartile Range (IQR) | 17.0% | 21.1% |
| Standard Deviation (Sample) | 23.4% | 16.7% |
| Standard Deviation (Population) | 23.2% | 16.2% |
Similar Demographics by Single Male Poverty
Demographics Similar to Pakistanis by Single Male Poverty
In terms of single male poverty, the demographic groups most similar to Pakistanis are Nicaraguan (12.4%, a difference of 0.050%), Immigrants from Southern Europe (12.4%, a difference of 0.15%), Kenyan (12.4%, a difference of 0.19%), Immigrants from Syria (12.4%, a difference of 0.21%), and Immigrants from Oceania (12.4%, a difference of 0.22%).
| Demographics | Rating | Rank | Single Male Poverty |
| Immigrants | Morocco | 95.6 /100 | #106 | Exceptional 12.3% |
| Iraqis | 95.1 /100 | #107 | Exceptional 12.3% |
| Immigrants | Eastern Africa | 95.0 /100 | #108 | Exceptional 12.3% |
| Ugandans | 94.5 /100 | #109 | Exceptional 12.3% |
| Immigrants | Portugal | 93.6 /100 | #110 | Exceptional 12.3% |
| Immigrants | North Macedonia | 93.6 /100 | #111 | Exceptional 12.3% |
| Kenyans | 93.3 /100 | #112 | Exceptional 12.4% |
| Pakistanis | 92.4 /100 | #113 | Exceptional 12.4% |
| Nicaraguans | 92.1 /100 | #114 | Exceptional 12.4% |
| Immigrants | Southern Europe | 91.5 /100 | #115 | Exceptional 12.4% |
| Immigrants | Syria | 91.2 /100 | #116 | Exceptional 12.4% |
| Immigrants | Oceania | 91.1 /100 | #117 | Exceptional 12.4% |
| Albanians | 90.6 /100 | #118 | Exceptional 12.4% |
| Immigrants | Albania | 90.3 /100 | #119 | Exceptional 12.4% |
| Venezuelans | 89.4 /100 | #120 | Excellent 12.4% |
Demographics Similar to Immigrants from Denmark by Single Male Poverty
In terms of single male poverty, the demographic groups most similar to Immigrants from Denmark are Somali (13.2%, a difference of 0.050%), Immigrants from the Azores (13.2%, a difference of 0.090%), Jamaican (13.2%, a difference of 0.16%), Immigrants from Western Europe (13.2%, a difference of 0.20%), and New Zealander (13.2%, a difference of 0.29%).
| Demographics | Rating | Rank | Single Male Poverty |
| Scandinavians | 12.9 /100 | #218 | Poor 13.1% |
| Immigrants | Burma/Myanmar | 12.6 /100 | #219 | Poor 13.1% |
| Central Americans | 10.9 /100 | #220 | Poor 13.2% |
| New Zealanders | 10.7 /100 | #221 | Poor 13.2% |
| Immigrants | Western Europe | 10.0 /100 | #222 | Poor 13.2% |
| Immigrants | Azores | 9.3 /100 | #223 | Tragic 13.2% |
| Somalis | 9.1 /100 | #224 | Tragic 13.2% |
| Immigrants | Denmark | 8.7 /100 | #225 | Tragic 13.2% |
| Jamaicans | 7.7 /100 | #226 | Tragic 13.2% |
| Haitians | 7.0 /100 | #227 | Tragic 13.2% |
| Lebanese | 6.6 /100 | #228 | Tragic 13.2% |
| Europeans | 6.2 /100 | #229 | Tragic 13.3% |
| Ghanaians | 6.1 /100 | #230 | Tragic 13.3% |
| Slavs | 5.3 /100 | #231 | Tragic 13.3% |
| Immigrants | Caribbean | 5.0 /100 | #232 | Tragic 13.3% |