Pakistani vs Immigrants from Saudi Arabia Single Male Poverty
COMPARE
Pakistani
Immigrants from Saudi Arabia
Single Male Poverty
Single Male Poverty Comparison
Pakistanis
Immigrants from Saudi Arabia
12.4%
SINGLE MALE POVERTY
92.4/ 100
METRIC RATING
113th/ 347
METRIC RANK
14.0%
SINGLE MALE POVERTY
0.1/ 100
METRIC RATING
270th/ 347
METRIC RANK
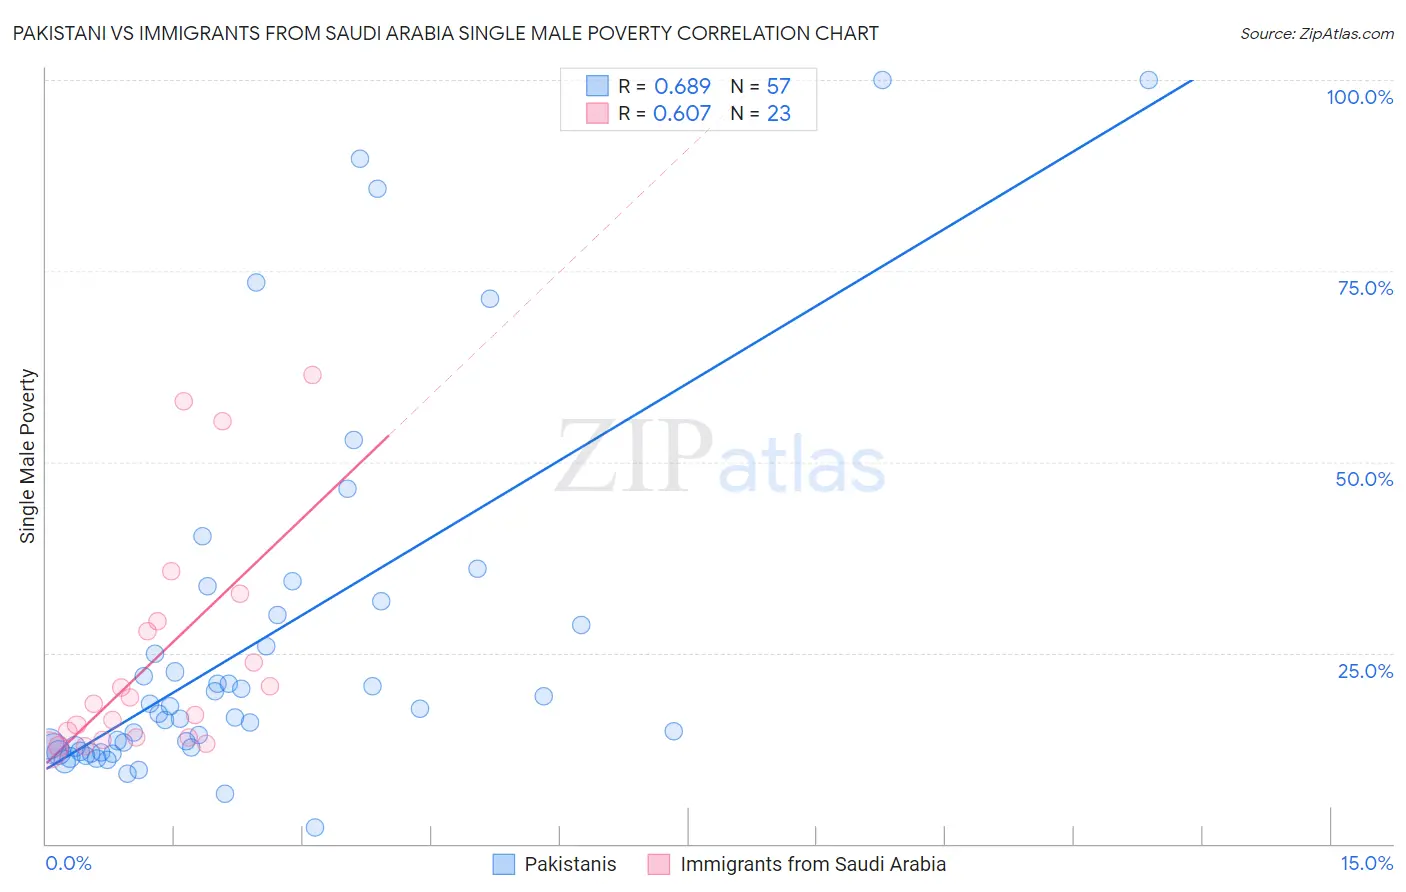
Pakistani vs Immigrants from Saudi Arabia Single Male Poverty Correlation Chart
The statistical analysis conducted on geographies consisting of 304,084,454 people shows a significant positive correlation between the proportion of Pakistanis and poverty level among single males in the United States with a correlation coefficient (R) of 0.689 and weighted average of 12.4%. Similarly, the statistical analysis conducted on geographies consisting of 155,832,907 people shows a significant positive correlation between the proportion of Immigrants from Saudi Arabia and poverty level among single males in the United States with a correlation coefficient (R) of 0.607 and weighted average of 14.0%, a difference of 12.9%.
Single Male Poverty Correlation Summary
| Measurement | Pakistani | Immigrants from Saudi Arabia |
| Minimum | 2.1% | 12.2% |
| Maximum | 100.0% | 61.3% |
| Range | 97.9% | 49.1% |
| Mean | 26.1% | 24.3% |
| Median | 17.0% | 18.3% |
| Interquartile 25% (IQ1) | 12.3% | 13.9% |
| Interquartile 75% (IQ3) | 29.3% | 29.1% |
| Interquartile Range (IQR) | 17.0% | 15.3% |
| Standard Deviation (Sample) | 23.4% | 15.0% |
| Standard Deviation (Population) | 23.2% | 14.7% |
Similar Demographics by Single Male Poverty
Demographics Similar to Pakistanis by Single Male Poverty
In terms of single male poverty, the demographic groups most similar to Pakistanis are Nicaraguan (12.4%, a difference of 0.050%), Immigrants from Southern Europe (12.4%, a difference of 0.15%), Kenyan (12.4%, a difference of 0.19%), Immigrants from Syria (12.4%, a difference of 0.21%), and Immigrants from Oceania (12.4%, a difference of 0.22%).
| Demographics | Rating | Rank | Single Male Poverty |
| Immigrants | Morocco | 95.6 /100 | #106 | Exceptional 12.3% |
| Iraqis | 95.1 /100 | #107 | Exceptional 12.3% |
| Immigrants | Eastern Africa | 95.0 /100 | #108 | Exceptional 12.3% |
| Ugandans | 94.5 /100 | #109 | Exceptional 12.3% |
| Immigrants | Portugal | 93.6 /100 | #110 | Exceptional 12.3% |
| Immigrants | North Macedonia | 93.6 /100 | #111 | Exceptional 12.3% |
| Kenyans | 93.3 /100 | #112 | Exceptional 12.4% |
| Pakistanis | 92.4 /100 | #113 | Exceptional 12.4% |
| Nicaraguans | 92.1 /100 | #114 | Exceptional 12.4% |
| Immigrants | Southern Europe | 91.5 /100 | #115 | Exceptional 12.4% |
| Immigrants | Syria | 91.2 /100 | #116 | Exceptional 12.4% |
| Immigrants | Oceania | 91.1 /100 | #117 | Exceptional 12.4% |
| Albanians | 90.6 /100 | #118 | Exceptional 12.4% |
| Immigrants | Albania | 90.3 /100 | #119 | Exceptional 12.4% |
| Venezuelans | 89.4 /100 | #120 | Excellent 12.4% |
Demographics Similar to Immigrants from Saudi Arabia by Single Male Poverty
In terms of single male poverty, the demographic groups most similar to Immigrants from Saudi Arabia are Scottish (14.0%, a difference of 0.010%), Irish (14.0%, a difference of 0.030%), Mexican (14.0%, a difference of 0.090%), Immigrants from Mexico (13.9%, a difference of 0.17%), and German (13.9%, a difference of 0.23%).
| Demographics | Rating | Rank | Single Male Poverty |
| Cape Verdeans | 0.2 /100 | #263 | Tragic 13.8% |
| West Indians | 0.2 /100 | #264 | Tragic 13.8% |
| Immigrants | Congo | 0.2 /100 | #265 | Tragic 13.9% |
| Immigrants | Cabo Verde | 0.1 /100 | #266 | Tragic 13.9% |
| Germans | 0.1 /100 | #267 | Tragic 13.9% |
| Immigrants | Mexico | 0.1 /100 | #268 | Tragic 13.9% |
| Scottish | 0.1 /100 | #269 | Tragic 14.0% |
| Immigrants | Saudi Arabia | 0.1 /100 | #270 | Tragic 14.0% |
| Irish | 0.1 /100 | #271 | Tragic 14.0% |
| Mexicans | 0.1 /100 | #272 | Tragic 14.0% |
| Welsh | 0.1 /100 | #273 | Tragic 14.0% |
| Hondurans | 0.1 /100 | #274 | Tragic 14.0% |
| English | 0.1 /100 | #275 | Tragic 14.1% |
| Dutch | 0.1 /100 | #276 | Tragic 14.1% |
| Immigrants | Honduras | 0.0 /100 | #277 | Tragic 14.1% |