Slavic vs U.S. Virgin Islander Single Male Poverty
COMPARE
Slavic
U.S. Virgin Islander
Single Male Poverty
Single Male Poverty Comparison
Slavs
U.S. Virgin Islanders
13.3%
SINGLE MALE POVERTY
5.3/ 100
METRIC RATING
231st/ 347
METRIC RANK
14.5%
SINGLE MALE POVERTY
0.0/ 100
METRIC RATING
290th/ 347
METRIC RANK
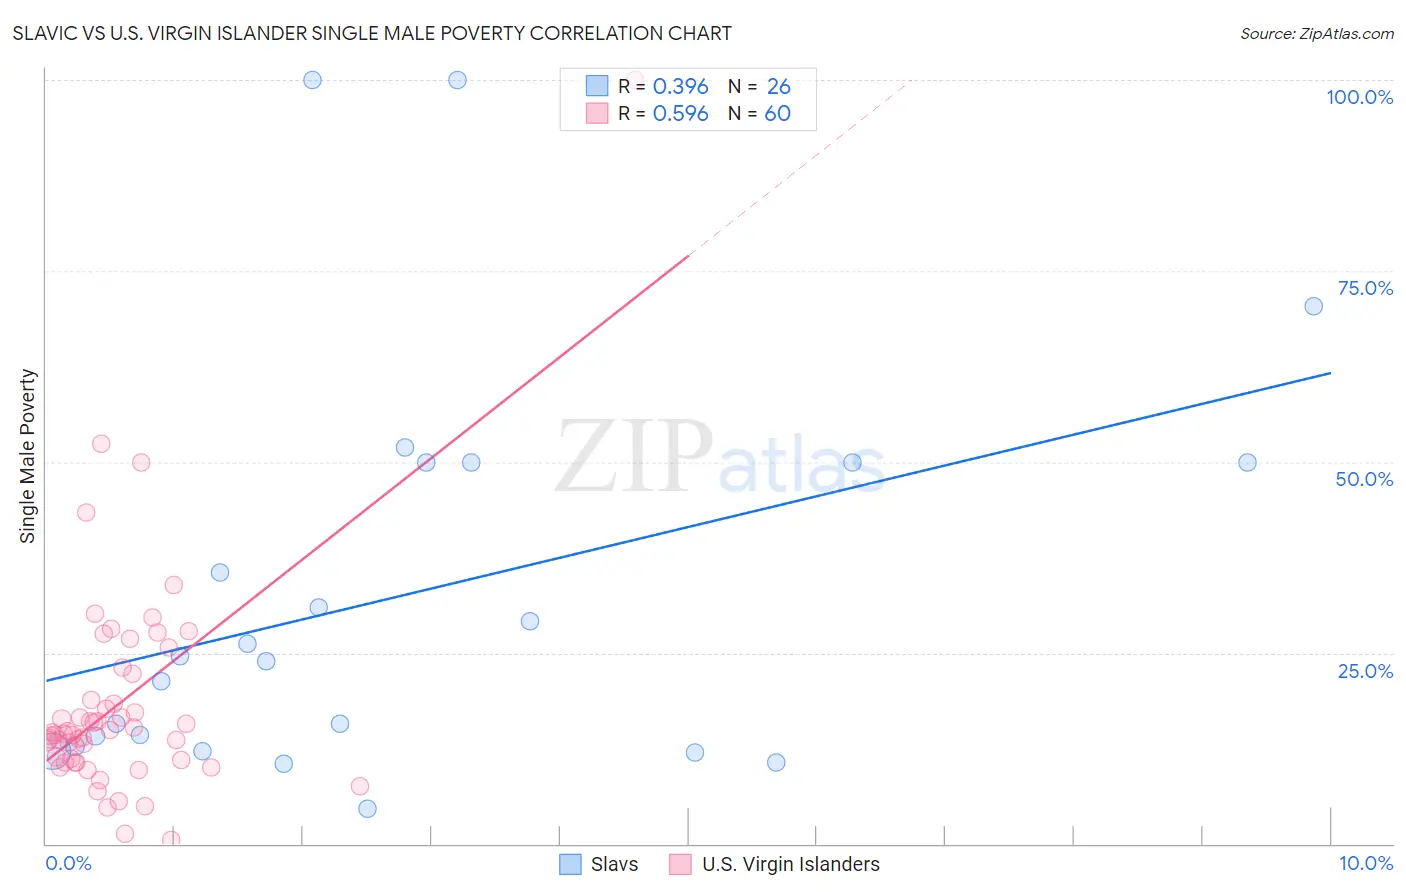
Slavic vs U.S. Virgin Islander Single Male Poverty Correlation Chart
The statistical analysis conducted on geographies consisting of 243,137,231 people shows a mild positive correlation between the proportion of Slavs and poverty level among single males in the United States with a correlation coefficient (R) of 0.396 and weighted average of 13.3%. Similarly, the statistical analysis conducted on geographies consisting of 85,320,269 people shows a substantial positive correlation between the proportion of U.S. Virgin Islanders and poverty level among single males in the United States with a correlation coefficient (R) of 0.596 and weighted average of 14.5%, a difference of 9.4%.
Single Male Poverty Correlation Summary
| Measurement | Slavic | U.S. Virgin Islander |
| Minimum | 4.5% | 0.45% |
| Maximum | 100.0% | 100.0% |
| Range | 95.5% | 99.5% |
| Mean | 32.6% | 18.4% |
| Median | 24.2% | 14.5% |
| Interquartile 25% (IQ1) | 12.8% | 10.8% |
| Interquartile 75% (IQ3) | 50.0% | 20.5% |
| Interquartile Range (IQR) | 37.2% | 9.7% |
| Standard Deviation (Sample) | 26.2% | 14.8% |
| Standard Deviation (Population) | 25.6% | 14.7% |
Similar Demographics by Single Male Poverty
Demographics Similar to Slavs by Single Male Poverty
In terms of single male poverty, the demographic groups most similar to Slavs are Immigrants from Caribbean (13.3%, a difference of 0.090%), Ghanaian (13.3%, a difference of 0.18%), European (13.3%, a difference of 0.20%), Lebanese (13.2%, a difference of 0.30%), and Haitian (13.2%, a difference of 0.38%).
| Demographics | Rating | Rank | Single Male Poverty |
| Somalis | 9.1 /100 | #224 | Tragic 13.2% |
| Immigrants | Denmark | 8.7 /100 | #225 | Tragic 13.2% |
| Jamaicans | 7.7 /100 | #226 | Tragic 13.2% |
| Haitians | 7.0 /100 | #227 | Tragic 13.2% |
| Lebanese | 6.6 /100 | #228 | Tragic 13.2% |
| Europeans | 6.2 /100 | #229 | Tragic 13.3% |
| Ghanaians | 6.1 /100 | #230 | Tragic 13.3% |
| Slavs | 5.3 /100 | #231 | Tragic 13.3% |
| Immigrants | Caribbean | 5.0 /100 | #232 | Tragic 13.3% |
| British | 4.0 /100 | #233 | Tragic 13.3% |
| Canadians | 4.0 /100 | #234 | Tragic 13.3% |
| Bangladeshis | 3.7 /100 | #235 | Tragic 13.3% |
| Luxembourgers | 3.6 /100 | #236 | Tragic 13.4% |
| British West Indians | 3.4 /100 | #237 | Tragic 13.4% |
| Immigrants | Ghana | 3.2 /100 | #238 | Tragic 13.4% |
Demographics Similar to U.S. Virgin Islanders by Single Male Poverty
In terms of single male poverty, the demographic groups most similar to U.S. Virgin Islanders are Bahamian (14.6%, a difference of 0.15%), Immigrants from Dominica (14.5%, a difference of 0.23%), Nonimmigrants (14.6%, a difference of 0.28%), White/Caucasian (14.5%, a difference of 0.31%), and Iroquois (14.5%, a difference of 0.32%).
| Demographics | Rating | Rank | Single Male Poverty |
| Yaqui | 0.0 /100 | #283 | Tragic 14.2% |
| Immigrants | Bahamas | 0.0 /100 | #284 | Tragic 14.4% |
| French | 0.0 /100 | #285 | Tragic 14.4% |
| Celtics | 0.0 /100 | #286 | Tragic 14.5% |
| Iroquois | 0.0 /100 | #287 | Tragic 14.5% |
| Whites/Caucasians | 0.0 /100 | #288 | Tragic 14.5% |
| Immigrants | Dominica | 0.0 /100 | #289 | Tragic 14.5% |
| U.S. Virgin Islanders | 0.0 /100 | #290 | Tragic 14.5% |
| Bahamians | 0.0 /100 | #291 | Tragic 14.6% |
| Immigrants | Nonimmigrants | 0.0 /100 | #292 | Tragic 14.6% |
| French Canadians | 0.0 /100 | #293 | Tragic 14.6% |
| Ottawa | 0.0 /100 | #294 | Tragic 14.6% |
| Scotch-Irish | 0.0 /100 | #295 | Tragic 14.7% |
| Africans | 0.0 /100 | #296 | Tragic 14.7% |
| Immigrants | Dominican Republic | 0.0 /100 | #297 | Tragic 14.8% |