Pakistani vs Egyptian Single Male Poverty

COMPARE

Pakistani
Race
Ancestry
AfghanAfricanAlaska NativeAlaskan AthabascanAlbanianAleutAlsatianAmericanApacheArabArapahoArgentineanArmenianAssyrian/Chaldean/SyriacAustralianAustrianBahamianBangladeshiBarbadianBasqueBelgianBelizeanBermudanBhutaneseBlackfeetBolivianBrazilianBritishBritish West IndianBulgarianBurmeseCajunCambodianCanadianCape VerdeanCarpatho RusynCelticCentral AmericanCentral American IndianCherokeeCheyenneChickasawChileanChineseChippewaChoctawColombianColvilleComancheCosta RicanCreeCreekCroatianCrowCubanCypriotCzechCzechoslovakianDanishDelawareDominicanDutchDutch West IndianEastern EuropeanEcuadorianEnglishEstonianEthiopianEuropeanFijianFilipinoFinnishFrenchFrench American IndianFrench CanadianGermanGerman RussianGhanaianGreekGuamanian/ChamorroGuatemalanGuyaneseHaitianHmongHonduranHopiHoumaHungarianIcelanderIndian (Asian)IndonesianInupiatIranianIraqiIrishIroquoisIsraeliItalianJamaicanJapaneseJordanianKenyanKiowaKoreanLaotianLatvianLebaneseLiberianLithuanianLumbeeLuxembourgerMacedonianMalaysianMalteseMarshalleseMenomineeMexicanMexican American IndianMongolianMoroccanNative HawaiianNavajoNepaleseNew ZealanderNicaraguanNigerianNorthern EuropeanNorwegianOkinawanOsageOttawaPaiutePakistaniPalestinianPanamanianParaguayanPennsylvania GermanPeruvianPimaPolishPortuguesePotawatomiPuebloPuerto RicanPuget Sound SalishRomanianRussianSalvadoranSamoanScandinavianScotch-IrishScottishSeminoleSenegaleseSerbianShoshoneSierra LeoneanSiouxSlavicSlovakSloveneSomaliSouth AfricanSouth AmericanSouth American IndianSoviet UnionSpaniardSpanishSpanish AmericanSpanish American IndianSri LankanSubsaharan AfricanSudaneseSwedishSwissSyrianTaiwaneseThaiTlingit-HaidaTohono O'OdhamTonganTrinidadian and TobagonianTsimshianTurkishU.S. Virgin IslanderUgandanUkrainianUruguayanUteVenezuelanVietnameseWelshWest IndianYakamaYaquiYugoslavianYumanYup'ikZimbabwean
Immigration
NonimmigrantsImmigrantsAfghanistanAfricaAlbaniaArgentinaArmeniaAsiaAustraliaAustriaBahamasBangladeshBarbadosBelarusBelgiumBelizeBoliviaBosnia and HerzegovinaBrazilBulgariaBurma/MyanmarCabo VerdeCambodiaCameroonCanadaCaribbeanCentral AmericaChileChinaColombiaCongoCosta RicaCroatiaCubaCzechoslovakiaDenmarkDominicaDominican RepublicEastern AfricaEastern AsiaEastern EuropeEcuadorEgyptEl SalvadorEnglandEritreaEthiopiaEuropeFijiFranceGermanyGhanaGreeceGrenadaGuatemalaGuyanaHaitiHondurasHong KongHungaryIndiaIndonesiaIranIraqIrelandIsraelItalyJamaicaJapanJordanKazakhstanKenyaKoreaKuwaitLaosLatin AmericaLatviaLebanonLiberiaLithuaniaMalaysiaMexicoMicronesiaMiddle AfricaMoldovaMoroccoNepalNetherlandsNicaraguaNigeriaNorth AmericaNorth MacedoniaNorthern AfricaNorthern EuropeNorwayOceaniaPakistanPanamaPeruPhilippinesPolandPortugalRomaniaRussiaSaudi ArabiaScotlandSenegalSerbiaSierra LeoneSingaporeSomaliaSouth AfricaSouth AmericaSouth Central AsiaSouth Eastern AsiaSouthern EuropeSpainSri LankaSt. Vincent and the GrenadinesSudanSwedenSwitzerlandSyriaTaiwanThailandTrinidad and TobagoTurkeyUgandaUkraineUruguayUzbekistanVenezuelaVietnamWest IndiesWestern AfricaWestern AsiaWestern EuropeYemenZaireZimbabweAzores
Egyptian
Race
Ancestry
AfghanAfricanAlaska NativeAlaskan AthabascanAlbanianAleutAlsatianAmericanApacheArabArapahoArgentineanArmenianAssyrian/Chaldean/SyriacAustralianAustrianBahamianBangladeshiBarbadianBasqueBelgianBelizeanBermudanBhutaneseBlackfeetBolivianBrazilianBritishBritish West IndianBulgarianBurmeseCajunCambodianCanadianCape VerdeanCarpatho RusynCelticCentral AmericanCentral American IndianCherokeeCheyenneChickasawChileanChineseChippewaChoctawColombianColvilleComancheCosta RicanCreeCreekCroatianCrowCubanCypriotCzechCzechoslovakianDanishDelawareDominicanDutchDutch West IndianEastern EuropeanEcuadorianEgyptianEnglishEstonianEthiopianEuropeanFijianFilipinoFinnishFrenchFrench American IndianFrench CanadianGermanGerman RussianGhanaianGreekGuamanian/ChamorroGuatemalanGuyaneseHaitianHmongHonduranHopiHoumaHungarianIcelanderIndian (Asian)IndonesianInupiatIranianIraqiIrishIroquoisIsraeliItalianJamaicanJapaneseJordanianKenyanKiowaKoreanLaotianLatvianLebaneseLiberianLithuanianLumbeeLuxembourgerMacedonianMalaysianMalteseMarshalleseMenomineeMexicanMexican American IndianMongolianMoroccanNative HawaiianNavajoNepaleseNew ZealanderNicaraguanNigerianNorthern EuropeanNorwegianOkinawanOsageOttawaPaiutePalestinianPanamanianParaguayanPennsylvania GermanPeruvianPimaPolishPortuguesePotawatomiPuebloPuerto RicanPuget Sound SalishRomanianRussianSalvadoranSamoanScandinavianScotch-IrishScottishSeminoleSenegaleseSerbianShoshoneSierra LeoneanSiouxSlavicSlovakSloveneSomaliSouth AfricanSouth AmericanSouth American IndianSoviet UnionSpaniardSpanishSpanish AmericanSpanish American IndianSri LankanSubsaharan AfricanSudaneseSwedishSwissSyrianTaiwaneseThaiTlingit-HaidaTohono O'OdhamTonganTrinidadian and TobagonianTsimshianTurkishU.S. Virgin IslanderUgandanUkrainianUruguayanUteVenezuelanVietnameseWelshWest IndianYakamaYaquiYugoslavianYumanYup'ikZimbabwean
Immigration
NonimmigrantsImmigrantsAfghanistanAfricaAlbaniaArgentinaArmeniaAsiaAustraliaAustriaBahamasBangladeshBarbadosBelarusBelgiumBelizeBoliviaBosnia and HerzegovinaBrazilBulgariaBurma/MyanmarCabo VerdeCambodiaCameroonCanadaCaribbeanCentral AmericaChileChinaColombiaCongoCosta RicaCroatiaCubaCzechoslovakiaDenmarkDominicaDominican RepublicEastern AfricaEastern AsiaEastern EuropeEcuadorEgyptEl SalvadorEnglandEritreaEthiopiaEuropeFijiFranceGermanyGhanaGreeceGrenadaGuatemalaGuyanaHaitiHondurasHong KongHungaryIndiaIndonesiaIranIraqIrelandIsraelItalyJamaicaJapanJordanKazakhstanKenyaKoreaKuwaitLaosLatin AmericaLatviaLebanonLiberiaLithuaniaMalaysiaMexicoMicronesiaMiddle AfricaMoldovaMoroccoNepalNetherlandsNicaraguaNigeriaNorth AmericaNorth MacedoniaNorthern AfricaNorthern EuropeNorwayOceaniaPakistanPanamaPeruPhilippinesPolandPortugalRomaniaRussiaSaudi ArabiaScotlandSenegalSerbiaSierra LeoneSingaporeSomaliaSouth AfricaSouth AmericaSouth Central AsiaSouth Eastern AsiaSouthern EuropeSpainSri LankaSt. Vincent and the GrenadinesSudanSwedenSwitzerlandSyriaTaiwanThailandTrinidad and TobagoTurkeyUgandaUkraineUruguayUzbekistanVenezuelaVietnamWest IndiesWestern AfricaWestern AsiaWestern EuropeYemenZaireZimbabweAzores
Single Male Poverty
Income
Poverty
Unemployment
Labor Participation
Family Structure
Vehicle Availability
Education Level
Disability

Single Male Poverty Comparison

Pakistanis

Egyptians

Exceptional
Exceptional
12.4%
SINGLE MALE POVERTY
92.4/ 100
METRIC RATING
113th/ 347
METRIC RANK
11.5%
SINGLE MALE POVERTY
99.9/ 100
METRIC RATING
42nd/ 347
METRIC RANK

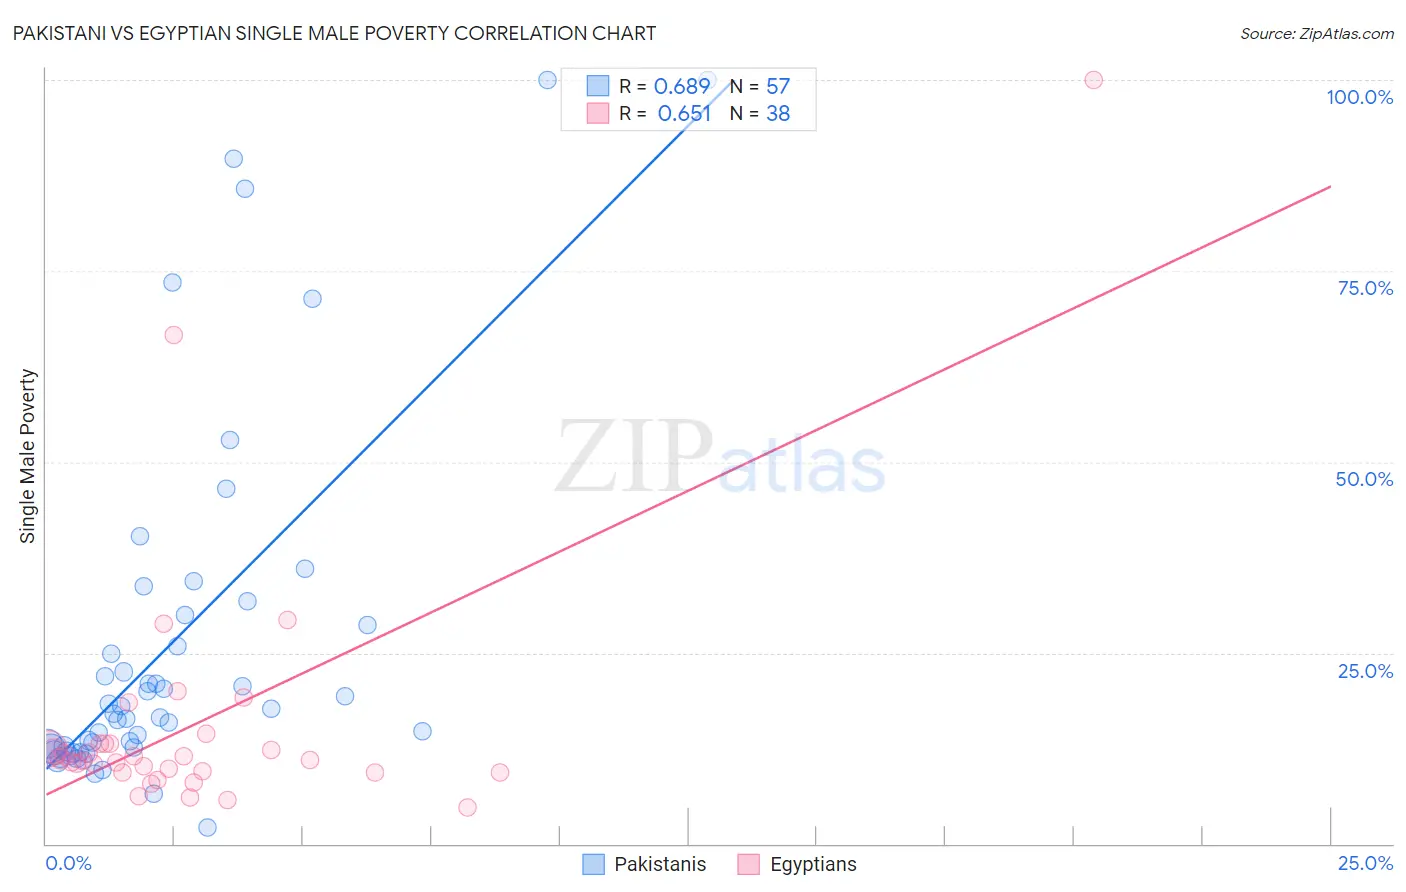
Pakistani vs Egyptian Single Male Poverty Correlation Chart

The statistical analysis conducted on geographies consisting of 304,084,454 people shows a significant positive correlation between the proportion of Pakistanis and poverty level among single males in the United States with a correlation coefficient (R) of 0.689 and weighted average of 12.4%. Similarly, the statistical analysis conducted on geographies consisting of 251,299,113 people shows a significant positive correlation between the proportion of Egyptians and poverty level among single males in the United States with a correlation coefficient (R) of 0.651 and weighted average of 11.5%, a difference of 7.4%.
Pakistani vs Egyptian Single Male Poverty

Single Male Poverty Correlation Summary

MeasurementPakistaniEgyptian
Minimum2.1%4.7%
Maximum100.0%100.0%
Range97.9%95.3%
Mean26.1%15.8%
Median17.0%11.0%
Interquartile 25% (IQ1)12.3%9.4%
Interquartile 75% (IQ3)29.3%13.1%
Interquartile Range (IQR)17.0%3.8%
Standard Deviation (Sample)23.4%17.4%
Standard Deviation (Population)23.2%17.2%

Similar Demographics by Single Male Poverty

Demographics Similar to Pakistanis by Single Male Poverty

In terms of single male poverty, the demographic groups most similar to Pakistanis are Nicaraguan (12.4%, a difference of 0.050%), Immigrants from Southern Europe (12.4%, a difference of 0.15%), Kenyan (12.4%, a difference of 0.19%), Immigrants from Syria (12.4%, a difference of 0.21%), and Immigrants from Oceania (12.4%, a difference of 0.22%).
DemographicsRating | RankSingle Male Poverty
Immigrants | Morocco
95.6
/100
|
#106
Exceptional
12.3%
Iraqis
95.1
/100
|
#107
Exceptional
12.3%
Immigrants | Eastern Africa
95.0
/100
|
#108
Exceptional
12.3%
Ugandans
94.5
/100
|
#109
Exceptional
12.3%
Immigrants | Portugal
93.6
/100
|
#110
Exceptional
12.3%
Immigrants | North Macedonia
93.6
/100
|
#111
Exceptional
12.3%
Kenyans
93.3
/100
|
#112
Exceptional
12.4%
Pakistanis
92.4
/100
|
#113
Exceptional
12.4%
Nicaraguans
92.1
/100
|
#114
Exceptional
12.4%
Immigrants | Southern Europe
91.5
/100
|
#115
Exceptional
12.4%
Immigrants | Syria
91.2
/100
|
#116
Exceptional
12.4%
Immigrants | Oceania
91.1
/100
|
#117
Exceptional
12.4%
Albanians
90.6
/100
|
#118
Exceptional
12.4%
Immigrants | Albania
90.3
/100
|
#119
Exceptional
12.4%
Venezuelans
89.4
/100
|
#120
Excellent
12.4%

Demographics Similar to Egyptians by Single Male Poverty

In terms of single male poverty, the demographic groups most similar to Egyptians are Immigrants from Iraq (11.5%, a difference of 0.050%), Immigrants from Peru (11.5%, a difference of 0.15%), Immigrants from Cameroon (11.5%, a difference of 0.17%), Immigrants from Poland (11.5%, a difference of 0.18%), and Immigrants from Korea (11.5%, a difference of 0.20%).
DemographicsRating | RankSingle Male Poverty
Immigrants | South Eastern Asia
100.0
/100
|
#35
Exceptional
11.4%
Immigrants | Serbia
100.0
/100
|
#36
Exceptional
11.4%
Immigrants | Singapore
100.0
/100
|
#37
Exceptional
11.4%
Sri Lankans
100.0
/100
|
#38
Exceptional
11.5%
Soviet Union
100.0
/100
|
#39
Exceptional
11.5%
Immigrants | Korea
100.0
/100
|
#40
Exceptional
11.5%
Immigrants | Iraq
99.9
/100
|
#41
Exceptional
11.5%
Egyptians
99.9
/100
|
#42
Exceptional
11.5%
Immigrants | Peru
99.9
/100
|
#43
Exceptional
11.5%
Immigrants | Cameroon
99.9
/100
|
#44
Exceptional
11.5%
Immigrants | Poland
99.9
/100
|
#45
Exceptional
11.5%
Immigrants | Bulgaria
99.9
/100
|
#46
Exceptional
11.6%
Nepalese
99.9
/100
|
#47
Exceptional
11.6%
Immigrants | Indonesia
99.9
/100
|
#48
Exceptional
11.6%
Tlingit-Haida
99.9
/100
|
#49
Exceptional
11.6%