Immigrants from Sudan vs U.S. Virgin Islander Single Male Poverty
COMPARE
Immigrants from Sudan
U.S. Virgin Islander
Single Male Poverty
Single Male Poverty Comparison
Immigrants from Sudan
U.S. Virgin Islanders
12.7%
SINGLE MALE POVERTY
58.2/ 100
METRIC RATING
167th/ 347
METRIC RANK
14.5%
SINGLE MALE POVERTY
0.0/ 100
METRIC RATING
290th/ 347
METRIC RANK
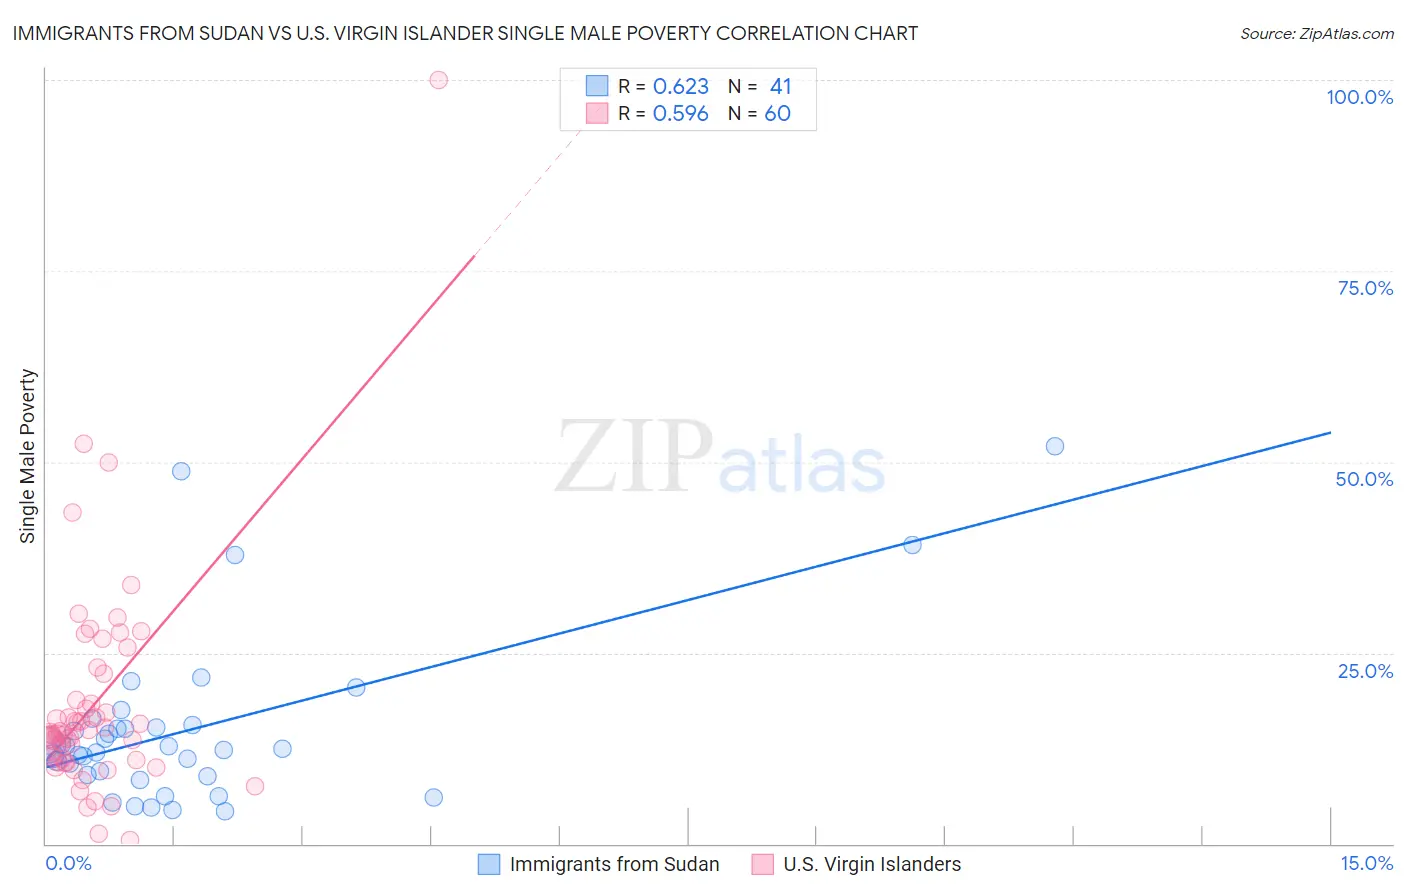
Immigrants from Sudan vs U.S. Virgin Islander Single Male Poverty Correlation Chart
The statistical analysis conducted on geographies consisting of 114,680,115 people shows a significant positive correlation between the proportion of Immigrants from Sudan and poverty level among single males in the United States with a correlation coefficient (R) of 0.623 and weighted average of 12.7%. Similarly, the statistical analysis conducted on geographies consisting of 85,320,269 people shows a substantial positive correlation between the proportion of U.S. Virgin Islanders and poverty level among single males in the United States with a correlation coefficient (R) of 0.596 and weighted average of 14.5%, a difference of 14.0%.
Single Male Poverty Correlation Summary
| Measurement | Immigrants from Sudan | U.S. Virgin Islander |
| Minimum | 4.2% | 0.45% |
| Maximum | 52.0% | 100.0% |
| Range | 47.8% | 99.5% |
| Mean | 14.9% | 18.4% |
| Median | 12.5% | 14.5% |
| Interquartile 25% (IQ1) | 8.9% | 10.8% |
| Interquartile 75% (IQ3) | 15.4% | 20.5% |
| Interquartile Range (IQR) | 6.5% | 9.7% |
| Standard Deviation (Sample) | 10.9% | 14.8% |
| Standard Deviation (Population) | 10.8% | 14.7% |
Similar Demographics by Single Male Poverty
Demographics Similar to Immigrants from Sudan by Single Male Poverty
In terms of single male poverty, the demographic groups most similar to Immigrants from Sudan are Immigrants from Barbados (12.7%, a difference of 0.030%), Immigrants from Guyana (12.7%, a difference of 0.13%), Puget Sound Salish (12.8%, a difference of 0.21%), Immigrants from Cambodia (12.7%, a difference of 0.22%), and Immigrants from Nigeria (12.7%, a difference of 0.26%).
| Demographics | Rating | Rank | Single Male Poverty |
| Greeks | 64.1 /100 | #160 | Good 12.7% |
| Immigrants | Africa | 63.4 /100 | #161 | Good 12.7% |
| Eastern Europeans | 63.3 /100 | #162 | Good 12.7% |
| Palestinians | 63.1 /100 | #163 | Good 12.7% |
| Immigrants | Nigeria | 62.8 /100 | #164 | Good 12.7% |
| Immigrants | Cambodia | 62.2 /100 | #165 | Good 12.7% |
| Immigrants | Guyana | 60.5 /100 | #166 | Good 12.7% |
| Immigrants | Sudan | 58.2 /100 | #167 | Average 12.7% |
| Immigrants | Barbados | 57.7 /100 | #168 | Average 12.7% |
| Puget Sound Salish | 54.3 /100 | #169 | Average 12.8% |
| Guyanese | 52.0 /100 | #170 | Average 12.8% |
| South Africans | 51.5 /100 | #171 | Average 12.8% |
| Danes | 51.4 /100 | #172 | Average 12.8% |
| Immigrants | St. Vincent and the Grenadines | 50.9 /100 | #173 | Average 12.8% |
| Costa Ricans | 50.0 /100 | #174 | Average 12.8% |
Demographics Similar to U.S. Virgin Islanders by Single Male Poverty
In terms of single male poverty, the demographic groups most similar to U.S. Virgin Islanders are Bahamian (14.6%, a difference of 0.15%), Immigrants from Dominica (14.5%, a difference of 0.23%), Nonimmigrants (14.6%, a difference of 0.28%), White/Caucasian (14.5%, a difference of 0.31%), and Iroquois (14.5%, a difference of 0.32%).
| Demographics | Rating | Rank | Single Male Poverty |
| Yaqui | 0.0 /100 | #283 | Tragic 14.2% |
| Immigrants | Bahamas | 0.0 /100 | #284 | Tragic 14.4% |
| French | 0.0 /100 | #285 | Tragic 14.4% |
| Celtics | 0.0 /100 | #286 | Tragic 14.5% |
| Iroquois | 0.0 /100 | #287 | Tragic 14.5% |
| Whites/Caucasians | 0.0 /100 | #288 | Tragic 14.5% |
| Immigrants | Dominica | 0.0 /100 | #289 | Tragic 14.5% |
| U.S. Virgin Islanders | 0.0 /100 | #290 | Tragic 14.5% |
| Bahamians | 0.0 /100 | #291 | Tragic 14.6% |
| Immigrants | Nonimmigrants | 0.0 /100 | #292 | Tragic 14.6% |
| French Canadians | 0.0 /100 | #293 | Tragic 14.6% |
| Ottawa | 0.0 /100 | #294 | Tragic 14.6% |
| Scotch-Irish | 0.0 /100 | #295 | Tragic 14.7% |
| Africans | 0.0 /100 | #296 | Tragic 14.7% |
| Immigrants | Dominican Republic | 0.0 /100 | #297 | Tragic 14.8% |