Pakistani vs Immigrants from Western Africa Single Male Poverty
COMPARE
Pakistani
Immigrants from Western Africa
Single Male Poverty
Single Male Poverty Comparison
Pakistanis
Immigrants from Western Africa
12.4%
SINGLE MALE POVERTY
92.4/ 100
METRIC RATING
113th/ 347
METRIC RANK
13.1%
SINGLE MALE POVERTY
17.6/ 100
METRIC RATING
208th/ 347
METRIC RANK
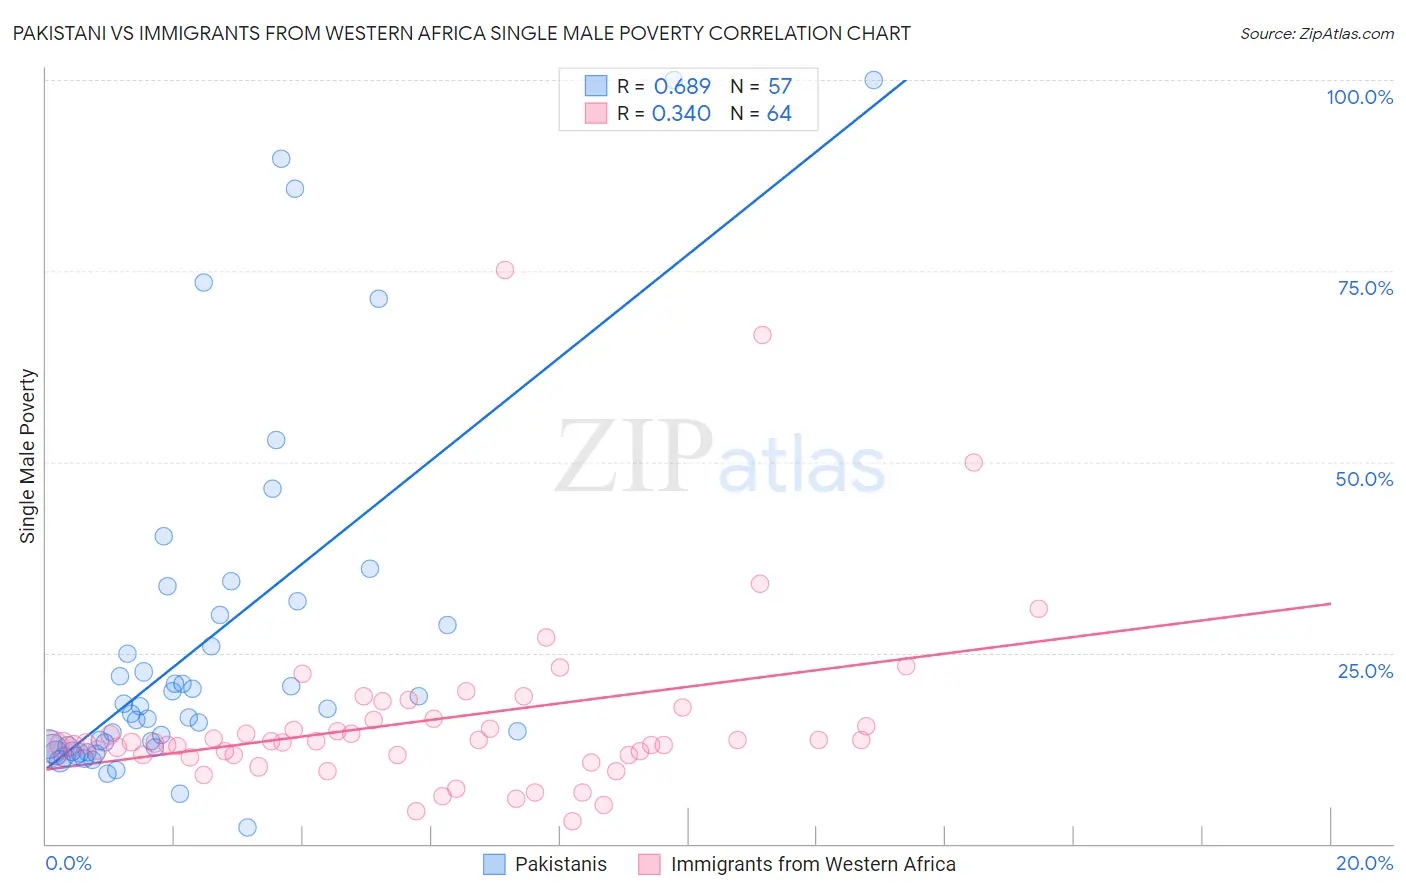
Pakistani vs Immigrants from Western Africa Single Male Poverty Correlation Chart
The statistical analysis conducted on geographies consisting of 304,084,454 people shows a significant positive correlation between the proportion of Pakistanis and poverty level among single males in the United States with a correlation coefficient (R) of 0.689 and weighted average of 12.4%. Similarly, the statistical analysis conducted on geographies consisting of 322,395,283 people shows a mild positive correlation between the proportion of Immigrants from Western Africa and poverty level among single males in the United States with a correlation coefficient (R) of 0.340 and weighted average of 13.1%, a difference of 5.5%.
Single Male Poverty Correlation Summary
| Measurement | Pakistani | Immigrants from Western Africa |
| Minimum | 2.1% | 2.9% |
| Maximum | 100.0% | 75.2% |
| Range | 97.9% | 72.3% |
| Mean | 26.1% | 16.2% |
| Median | 17.0% | 13.2% |
| Interquartile 25% (IQ1) | 12.3% | 11.6% |
| Interquartile 75% (IQ3) | 29.3% | 16.3% |
| Interquartile Range (IQR) | 17.0% | 4.7% |
| Standard Deviation (Sample) | 23.4% | 12.3% |
| Standard Deviation (Population) | 23.2% | 12.2% |
Similar Demographics by Single Male Poverty
Demographics Similar to Pakistanis by Single Male Poverty
In terms of single male poverty, the demographic groups most similar to Pakistanis are Nicaraguan (12.4%, a difference of 0.050%), Immigrants from Southern Europe (12.4%, a difference of 0.15%), Kenyan (12.4%, a difference of 0.19%), Immigrants from Syria (12.4%, a difference of 0.21%), and Immigrants from Oceania (12.4%, a difference of 0.22%).
| Demographics | Rating | Rank | Single Male Poverty |
| Immigrants | Morocco | 95.6 /100 | #106 | Exceptional 12.3% |
| Iraqis | 95.1 /100 | #107 | Exceptional 12.3% |
| Immigrants | Eastern Africa | 95.0 /100 | #108 | Exceptional 12.3% |
| Ugandans | 94.5 /100 | #109 | Exceptional 12.3% |
| Immigrants | Portugal | 93.6 /100 | #110 | Exceptional 12.3% |
| Immigrants | North Macedonia | 93.6 /100 | #111 | Exceptional 12.3% |
| Kenyans | 93.3 /100 | #112 | Exceptional 12.4% |
| Pakistanis | 92.4 /100 | #113 | Exceptional 12.4% |
| Nicaraguans | 92.1 /100 | #114 | Exceptional 12.4% |
| Immigrants | Southern Europe | 91.5 /100 | #115 | Exceptional 12.4% |
| Immigrants | Syria | 91.2 /100 | #116 | Exceptional 12.4% |
| Immigrants | Oceania | 91.1 /100 | #117 | Exceptional 12.4% |
| Albanians | 90.6 /100 | #118 | Exceptional 12.4% |
| Immigrants | Albania | 90.3 /100 | #119 | Exceptional 12.4% |
| Venezuelans | 89.4 /100 | #120 | Excellent 12.4% |
Demographics Similar to Immigrants from Western Africa by Single Male Poverty
In terms of single male poverty, the demographic groups most similar to Immigrants from Western Africa are Sudanese (13.1%, a difference of 0.010%), Mexican American Indian (13.1%, a difference of 0.010%), Immigrants from Haiti (13.1%, a difference of 0.070%), Swedish (13.1%, a difference of 0.080%), and Northern European (13.0%, a difference of 0.11%).
| Demographics | Rating | Rank | Single Male Poverty |
| Trinidadians and Tobagonians | 21.4 /100 | #201 | Fair 13.0% |
| Basques | 20.7 /100 | #202 | Fair 13.0% |
| Immigrants | Bangladesh | 20.4 /100 | #203 | Fair 13.0% |
| Estonians | 20.3 /100 | #204 | Fair 13.0% |
| Poles | 19.3 /100 | #205 | Poor 13.0% |
| Northern Europeans | 18.9 /100 | #206 | Poor 13.0% |
| Sudanese | 17.7 /100 | #207 | Poor 13.1% |
| Immigrants | Western Africa | 17.6 /100 | #208 | Poor 13.1% |
| Mexican American Indians | 17.5 /100 | #209 | Poor 13.1% |
| Immigrants | Haiti | 16.8 /100 | #210 | Poor 13.1% |
| Swedes | 16.8 /100 | #211 | Poor 13.1% |
| Senegalese | 16.4 /100 | #212 | Poor 13.1% |
| Italians | 15.9 /100 | #213 | Poor 13.1% |
| Zimbabweans | 14.9 /100 | #214 | Poor 13.1% |
| Japanese | 14.8 /100 | #215 | Poor 13.1% |