Okinawan vs Immigrants from Zimbabwe Single Father Poverty
COMPARE
Okinawan
Immigrants from Zimbabwe
Single Father Poverty
Single Father Poverty Comparison
Okinawans
Immigrants from Zimbabwe
14.6%
SINGLE FATHER POVERTY
100.0/ 100
METRIC RATING
33rd/ 347
METRIC RANK
16.1%
SINGLE FATHER POVERTY
72.1/ 100
METRIC RATING
152nd/ 347
METRIC RANK
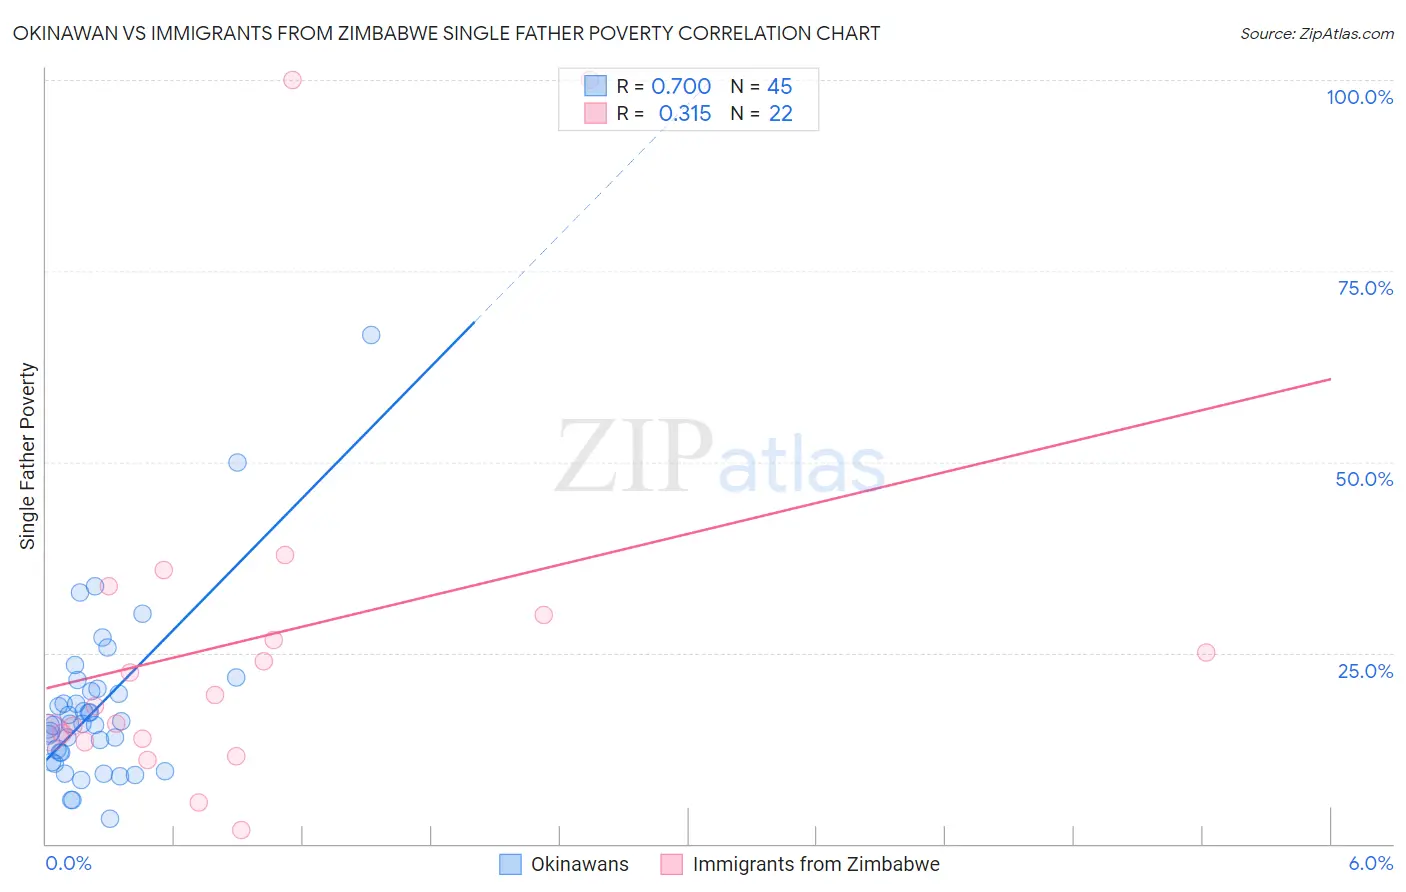
Okinawan vs Immigrants from Zimbabwe Single Father Poverty Correlation Chart
The statistical analysis conducted on geographies consisting of 67,888,416 people shows a strong positive correlation between the proportion of Okinawans and poverty level among single fathers in the United States with a correlation coefficient (R) of 0.700 and weighted average of 14.6%. Similarly, the statistical analysis conducted on geographies consisting of 105,577,503 people shows a mild positive correlation between the proportion of Immigrants from Zimbabwe and poverty level among single fathers in the United States with a correlation coefficient (R) of 0.315 and weighted average of 16.1%, a difference of 10.1%.
Single Father Poverty Correlation Summary
| Measurement | Okinawan | Immigrants from Zimbabwe |
| Minimum | 3.3% | 1.8% |
| Maximum | 66.7% | 100.0% |
| Range | 63.4% | 98.2% |
| Mean | 17.9% | 26.8% |
| Median | 15.8% | 18.8% |
| Interquartile 25% (IQ1) | 11.3% | 13.8% |
| Interquartile 75% (IQ3) | 20.1% | 30.0% |
| Interquartile Range (IQR) | 8.8% | 16.2% |
| Standard Deviation (Sample) | 11.2% | 25.5% |
| Standard Deviation (Population) | 11.1% | 24.9% |
Similar Demographics by Single Father Poverty
Demographics Similar to Okinawans by Single Father Poverty
In terms of single father poverty, the demographic groups most similar to Okinawans are Egyptian (14.7%, a difference of 0.10%), Immigrants from Bolivia (14.7%, a difference of 0.17%), Immigrants from Indonesia (14.7%, a difference of 0.33%), Immigrants from Eastern Africa (14.7%, a difference of 0.46%), and Bolivian (14.7%, a difference of 0.47%).
| Demographics | Rating | Rank | Single Father Poverty |
| Spanish American Indians | 100.0 /100 | #26 | Exceptional 14.4% |
| Nepalese | 100.0 /100 | #27 | Exceptional 14.4% |
| Immigrants | South Central Asia | 100.0 /100 | #28 | Exceptional 14.5% |
| Somalis | 100.0 /100 | #29 | Exceptional 14.5% |
| Thais | 100.0 /100 | #30 | Exceptional 14.5% |
| Icelanders | 100.0 /100 | #31 | Exceptional 14.5% |
| Asians | 100.0 /100 | #32 | Exceptional 14.6% |
| Okinawans | 100.0 /100 | #33 | Exceptional 14.6% |
| Egyptians | 100.0 /100 | #34 | Exceptional 14.7% |
| Immigrants | Bolivia | 100.0 /100 | #35 | Exceptional 14.7% |
| Immigrants | Indonesia | 100.0 /100 | #36 | Exceptional 14.7% |
| Immigrants | Eastern Africa | 100.0 /100 | #37 | Exceptional 14.7% |
| Bolivians | 100.0 /100 | #38 | Exceptional 14.7% |
| Immigrants | Asia | 100.0 /100 | #39 | Exceptional 14.7% |
| Pima | 100.0 /100 | #40 | Exceptional 14.8% |
Demographics Similar to Immigrants from Zimbabwe by Single Father Poverty
In terms of single father poverty, the demographic groups most similar to Immigrants from Zimbabwe are Immigrants from Israel (16.1%, a difference of 0.0%), Immigrants from France (16.1%, a difference of 0.060%), Mexican (16.1%, a difference of 0.10%), Jordanian (16.1%, a difference of 0.12%), and South African (16.1%, a difference of 0.18%).
| Demographics | Rating | Rank | Single Father Poverty |
| Immigrants | Western Asia | 80.7 /100 | #145 | Excellent 16.0% |
| Immigrants | Hungary | 78.3 /100 | #146 | Good 16.1% |
| Colombians | 77.1 /100 | #147 | Good 16.1% |
| Nigerians | 76.8 /100 | #148 | Good 16.1% |
| South Africans | 75.1 /100 | #149 | Good 16.1% |
| Jordanians | 74.2 /100 | #150 | Good 16.1% |
| Immigrants | France | 73.1 /100 | #151 | Good 16.1% |
| Immigrants | Zimbabwe | 72.1 /100 | #152 | Good 16.1% |
| Immigrants | Israel | 72.0 /100 | #153 | Good 16.1% |
| Mexicans | 70.1 /100 | #154 | Good 16.1% |
| Immigrants | Nicaragua | 67.8 /100 | #155 | Good 16.2% |
| Immigrants | Jordan | 66.0 /100 | #156 | Good 16.2% |
| Immigrants | Czechoslovakia | 62.8 /100 | #157 | Good 16.2% |
| Portuguese | 62.3 /100 | #158 | Good 16.2% |
| Belizeans | 59.9 /100 | #159 | Average 16.2% |