Okinawan vs Immigrants from England Single Father Poverty
COMPARE
Okinawan
Immigrants from England
Single Father Poverty
Single Father Poverty Comparison
Okinawans
Immigrants from England
14.6%
SINGLE FATHER POVERTY
100.0/ 100
METRIC RATING
33rd/ 347
METRIC RANK
16.7%
SINGLE FATHER POVERTY
9.5/ 100
METRIC RATING
216th/ 347
METRIC RANK
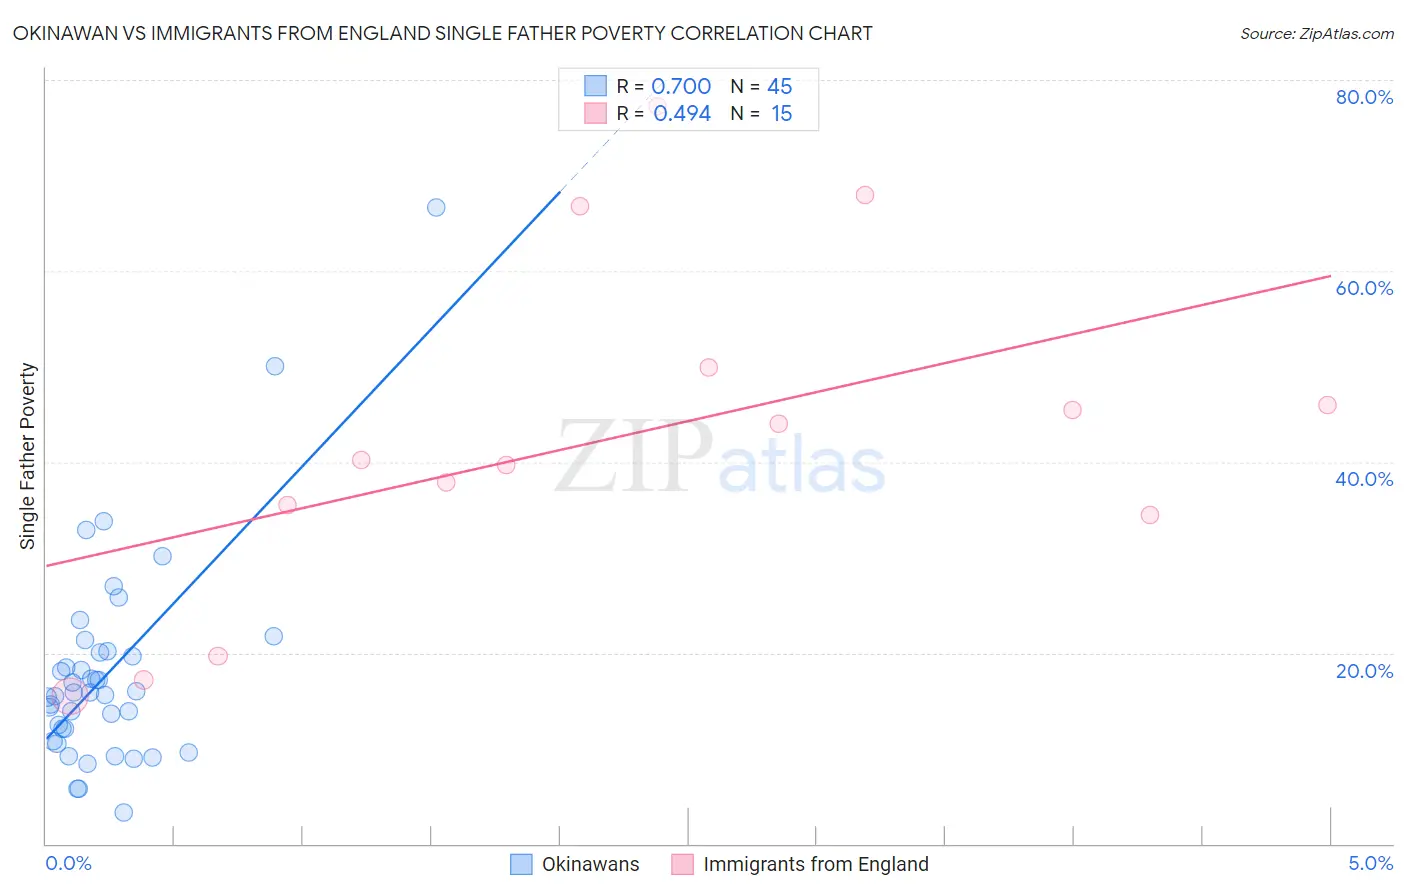
Okinawan vs Immigrants from England Single Father Poverty Correlation Chart
The statistical analysis conducted on geographies consisting of 67,888,416 people shows a strong positive correlation between the proportion of Okinawans and poverty level among single fathers in the United States with a correlation coefficient (R) of 0.700 and weighted average of 14.6%. Similarly, the statistical analysis conducted on geographies consisting of 303,741,945 people shows a moderate positive correlation between the proportion of Immigrants from England and poverty level among single fathers in the United States with a correlation coefficient (R) of 0.494 and weighted average of 16.7%, a difference of 14.1%.
Single Father Poverty Correlation Summary
| Measurement | Okinawan | Immigrants from England |
| Minimum | 3.3% | 15.5% |
| Maximum | 66.7% | 77.3% |
| Range | 63.4% | 61.8% |
| Mean | 17.9% | 42.5% |
| Median | 15.8% | 40.2% |
| Interquartile 25% (IQ1) | 11.3% | 34.4% |
| Interquartile 75% (IQ3) | 20.1% | 49.9% |
| Interquartile Range (IQR) | 8.8% | 15.5% |
| Standard Deviation (Sample) | 11.2% | 18.1% |
| Standard Deviation (Population) | 11.1% | 17.4% |
Similar Demographics by Single Father Poverty
Demographics Similar to Okinawans by Single Father Poverty
In terms of single father poverty, the demographic groups most similar to Okinawans are Egyptian (14.7%, a difference of 0.10%), Immigrants from Bolivia (14.7%, a difference of 0.17%), Immigrants from Indonesia (14.7%, a difference of 0.33%), Immigrants from Eastern Africa (14.7%, a difference of 0.46%), and Bolivian (14.7%, a difference of 0.47%).
| Demographics | Rating | Rank | Single Father Poverty |
| Spanish American Indians | 100.0 /100 | #26 | Exceptional 14.4% |
| Nepalese | 100.0 /100 | #27 | Exceptional 14.4% |
| Immigrants | South Central Asia | 100.0 /100 | #28 | Exceptional 14.5% |
| Somalis | 100.0 /100 | #29 | Exceptional 14.5% |
| Thais | 100.0 /100 | #30 | Exceptional 14.5% |
| Icelanders | 100.0 /100 | #31 | Exceptional 14.5% |
| Asians | 100.0 /100 | #32 | Exceptional 14.6% |
| Okinawans | 100.0 /100 | #33 | Exceptional 14.6% |
| Egyptians | 100.0 /100 | #34 | Exceptional 14.7% |
| Immigrants | Bolivia | 100.0 /100 | #35 | Exceptional 14.7% |
| Immigrants | Indonesia | 100.0 /100 | #36 | Exceptional 14.7% |
| Immigrants | Eastern Africa | 100.0 /100 | #37 | Exceptional 14.7% |
| Bolivians | 100.0 /100 | #38 | Exceptional 14.7% |
| Immigrants | Asia | 100.0 /100 | #39 | Exceptional 14.7% |
| Pima | 100.0 /100 | #40 | Exceptional 14.8% |
Demographics Similar to Immigrants from England by Single Father Poverty
In terms of single father poverty, the demographic groups most similar to Immigrants from England are Immigrants from Scotland (16.7%, a difference of 0.0%), Cheyenne (16.7%, a difference of 0.030%), Immigrants from Uganda (16.7%, a difference of 0.13%), Spanish (16.7%, a difference of 0.14%), and Ghanaian (16.7%, a difference of 0.17%).
| Demographics | Rating | Rank | Single Father Poverty |
| Europeans | 13.2 /100 | #209 | Poor 16.6% |
| Guatemalans | 12.9 /100 | #210 | Poor 16.6% |
| Arabs | 12.8 /100 | #211 | Poor 16.6% |
| Immigrants | Southern Europe | 11.2 /100 | #212 | Poor 16.7% |
| Ghanaians | 11.0 /100 | #213 | Poor 16.7% |
| Spanish | 10.7 /100 | #214 | Poor 16.7% |
| Immigrants | Scotland | 9.6 /100 | #215 | Tragic 16.7% |
| Immigrants | England | 9.5 /100 | #216 | Tragic 16.7% |
| Cheyenne | 9.3 /100 | #217 | Tragic 16.7% |
| Immigrants | Uganda | 8.6 /100 | #218 | Tragic 16.7% |
| Immigrants | Ghana | 8.1 /100 | #219 | Tragic 16.7% |
| Immigrants | Denmark | 8.1 /100 | #220 | Tragic 16.7% |
| Immigrants | Greece | 8.1 /100 | #221 | Tragic 16.7% |
| Immigrants | Spain | 8.0 /100 | #222 | Tragic 16.7% |
| Immigrants | Austria | 7.0 /100 | #223 | Tragic 16.8% |