Okinawan vs Japanese Single Father Poverty

COMPARE

Okinawan
Race
Ancestry
AfghanAfricanAlaska NativeAlaskan AthabascanAlbanianAleutAlsatianAmericanApacheArabArapahoArgentineanArmenianAssyrian/Chaldean/SyriacAustralianAustrianBahamianBangladeshiBarbadianBasqueBelgianBelizeanBermudanBhutaneseBlackfeetBolivianBrazilianBritishBritish West IndianBulgarianBurmeseCajunCambodianCanadianCape VerdeanCarpatho RusynCelticCentral AmericanCentral American IndianCherokeeCheyenneChickasawChileanChineseChippewaChoctawColombianColvilleComancheCosta RicanCreeCreekCroatianCrowCubanCypriotCzechCzechoslovakianDanishDelawareDominicanDutchDutch West IndianEastern EuropeanEcuadorianEgyptianEnglishEstonianEthiopianEuropeanFijianFilipinoFinnishFrenchFrench American IndianFrench CanadianGermanGerman RussianGhanaianGreekGuamanian/ChamorroGuatemalanGuyaneseHaitianHmongHonduranHopiHoumaHungarianIcelanderIndian (Asian)IndonesianInupiatIranianIraqiIrishIroquoisIsraeliItalianJamaicanJordanianKenyanKiowaKoreanLaotianLatvianLebaneseLiberianLithuanianLumbeeLuxembourgerMacedonianMalaysianMalteseMarshalleseMenomineeMexicanMexican American IndianMongolianMoroccanNative HawaiianNavajoNepaleseNew ZealanderNicaraguanNigerianNorthern EuropeanNorwegianOkinawanOsageOttawaPaiutePakistaniPalestinianPanamanianParaguayanPennsylvania GermanPeruvianPimaPolishPortuguesePotawatomiPuebloPuerto RicanPuget Sound SalishRomanianRussianSalvadoranSamoanScandinavianScotch-IrishScottishSeminoleSenegaleseSerbianShoshoneSierra LeoneanSiouxSlavicSlovakSloveneSomaliSouth AfricanSouth AmericanSouth American IndianSoviet UnionSpaniardSpanishSpanish AmericanSpanish American IndianSri LankanSubsaharan AfricanSudaneseSwedishSwissSyrianTaiwaneseThaiTlingit-HaidaTohono O'OdhamTonganTrinidadian and TobagonianTsimshianTurkishU.S. Virgin IslanderUgandanUkrainianUruguayanUteVenezuelanVietnameseWelshWest IndianYakamaYaquiYugoslavianYumanYup'ikZimbabwean
Immigration
NonimmigrantsImmigrantsAfghanistanAfricaAlbaniaArgentinaArmeniaAsiaAustraliaAustriaBahamasBangladeshBarbadosBelarusBelgiumBelizeBoliviaBosnia and HerzegovinaBrazilBulgariaBurma/MyanmarCabo VerdeCambodiaCameroonCanadaCaribbeanCentral AmericaChileChinaColombiaCongoCosta RicaCroatiaCubaCzechoslovakiaDenmarkDominicaDominican RepublicEastern AfricaEastern AsiaEastern EuropeEcuadorEgyptEl SalvadorEnglandEritreaEthiopiaEuropeFijiFranceGermanyGhanaGreeceGrenadaGuatemalaGuyanaHaitiHondurasHong KongHungaryIndiaIndonesiaIranIraqIrelandIsraelItalyJamaicaJapanJordanKazakhstanKenyaKoreaKuwaitLaosLatin AmericaLatviaLebanonLiberiaLithuaniaMalaysiaMexicoMicronesiaMiddle AfricaMoldovaMoroccoNepalNetherlandsNicaraguaNigeriaNorth AmericaNorth MacedoniaNorthern AfricaNorthern EuropeNorwayOceaniaPakistanPanamaPeruPhilippinesPolandPortugalRomaniaRussiaSaudi ArabiaScotlandSenegalSerbiaSierra LeoneSingaporeSomaliaSouth AfricaSouth AmericaSouth Central AsiaSouth Eastern AsiaSouthern EuropeSpainSri LankaSt. Vincent and the GrenadinesSudanSwedenSwitzerlandSyriaTaiwanThailandTrinidad and TobagoTurkeyUgandaUkraineUruguayUzbekistanVenezuelaVietnamWest IndiesWestern AfricaWestern AsiaWestern EuropeYemenZaireZimbabweAzores
Japanese
Race
Ancestry
AfghanAfricanAlaska NativeAlaskan AthabascanAlbanianAleutAlsatianAmericanApacheArabArapahoArgentineanArmenianAssyrian/Chaldean/SyriacAustralianAustrianBahamianBangladeshiBarbadianBasqueBelgianBelizeanBermudanBhutaneseBlackfeetBolivianBrazilianBritishBritish West IndianBulgarianBurmeseCajunCambodianCanadianCape VerdeanCarpatho RusynCelticCentral AmericanCentral American IndianCherokeeCheyenneChickasawChileanChineseChippewaChoctawColombianColvilleComancheCosta RicanCreeCreekCroatianCrowCubanCypriotCzechCzechoslovakianDanishDelawareDominicanDutchDutch West IndianEastern EuropeanEcuadorianEgyptianEnglishEstonianEthiopianEuropeanFijianFilipinoFinnishFrenchFrench American IndianFrench CanadianGermanGerman RussianGhanaianGreekGuamanian/ChamorroGuatemalanGuyaneseHaitianHmongHonduranHopiHoumaHungarianIcelanderIndian (Asian)IndonesianInupiatIranianIraqiIrishIroquoisIsraeliItalianJamaicanJapaneseJordanianKenyanKiowaKoreanLaotianLatvianLebaneseLiberianLithuanianLumbeeLuxembourgerMacedonianMalaysianMalteseMarshalleseMenomineeMexicanMexican American IndianMongolianMoroccanNative HawaiianNavajoNepaleseNew ZealanderNicaraguanNigerianNorthern EuropeanNorwegianOsageOttawaPaiutePakistaniPalestinianPanamanianParaguayanPennsylvania GermanPeruvianPimaPolishPortuguesePotawatomiPuebloPuerto RicanPuget Sound SalishRomanianRussianSalvadoranSamoanScandinavianScotch-IrishScottishSeminoleSenegaleseSerbianShoshoneSierra LeoneanSiouxSlavicSlovakSloveneSomaliSouth AfricanSouth AmericanSouth American IndianSoviet UnionSpaniardSpanishSpanish AmericanSpanish American IndianSri LankanSubsaharan AfricanSudaneseSwedishSwissSyrianTaiwaneseThaiTlingit-HaidaTohono O'OdhamTonganTrinidadian and TobagonianTsimshianTurkishU.S. Virgin IslanderUgandanUkrainianUruguayanUteVenezuelanVietnameseWelshWest IndianYakamaYaquiYugoslavianYumanYup'ikZimbabwean
Immigration
NonimmigrantsImmigrantsAfghanistanAfricaAlbaniaArgentinaArmeniaAsiaAustraliaAustriaBahamasBangladeshBarbadosBelarusBelgiumBelizeBoliviaBosnia and HerzegovinaBrazilBulgariaBurma/MyanmarCabo VerdeCambodiaCameroonCanadaCaribbeanCentral AmericaChileChinaColombiaCongoCosta RicaCroatiaCubaCzechoslovakiaDenmarkDominicaDominican RepublicEastern AfricaEastern AsiaEastern EuropeEcuadorEgyptEl SalvadorEnglandEritreaEthiopiaEuropeFijiFranceGermanyGhanaGreeceGrenadaGuatemalaGuyanaHaitiHondurasHong KongHungaryIndiaIndonesiaIranIraqIrelandIsraelItalyJamaicaJapanJordanKazakhstanKenyaKoreaKuwaitLaosLatin AmericaLatviaLebanonLiberiaLithuaniaMalaysiaMexicoMicronesiaMiddle AfricaMoldovaMoroccoNepalNetherlandsNicaraguaNigeriaNorth AmericaNorth MacedoniaNorthern AfricaNorthern EuropeNorwayOceaniaPakistanPanamaPeruPhilippinesPolandPortugalRomaniaRussiaSaudi ArabiaScotlandSenegalSerbiaSierra LeoneSingaporeSomaliaSouth AfricaSouth AmericaSouth Central AsiaSouth Eastern AsiaSouthern EuropeSpainSri LankaSt. Vincent and the GrenadinesSudanSwedenSwitzerlandSyriaTaiwanThailandTrinidad and TobagoTurkeyUgandaUkraineUruguayUzbekistanVenezuelaVietnamWest IndiesWestern AfricaWestern AsiaWestern EuropeYemenZaireZimbabweAzores
Single Father Poverty
Income
Poverty
Unemployment
Labor Participation
Family Structure
Vehicle Availability
Education Level
Disability

Single Father Poverty Comparison

Okinawans

Japanese

Exceptional
Exceptional
14.6%
SINGLE FATHER POVERTY
100.0/ 100
METRIC RATING
33rd/ 347
METRIC RANK
15.2%
SINGLE FATHER POVERTY
99.7/ 100
METRIC RATING
69th/ 347
METRIC RANK

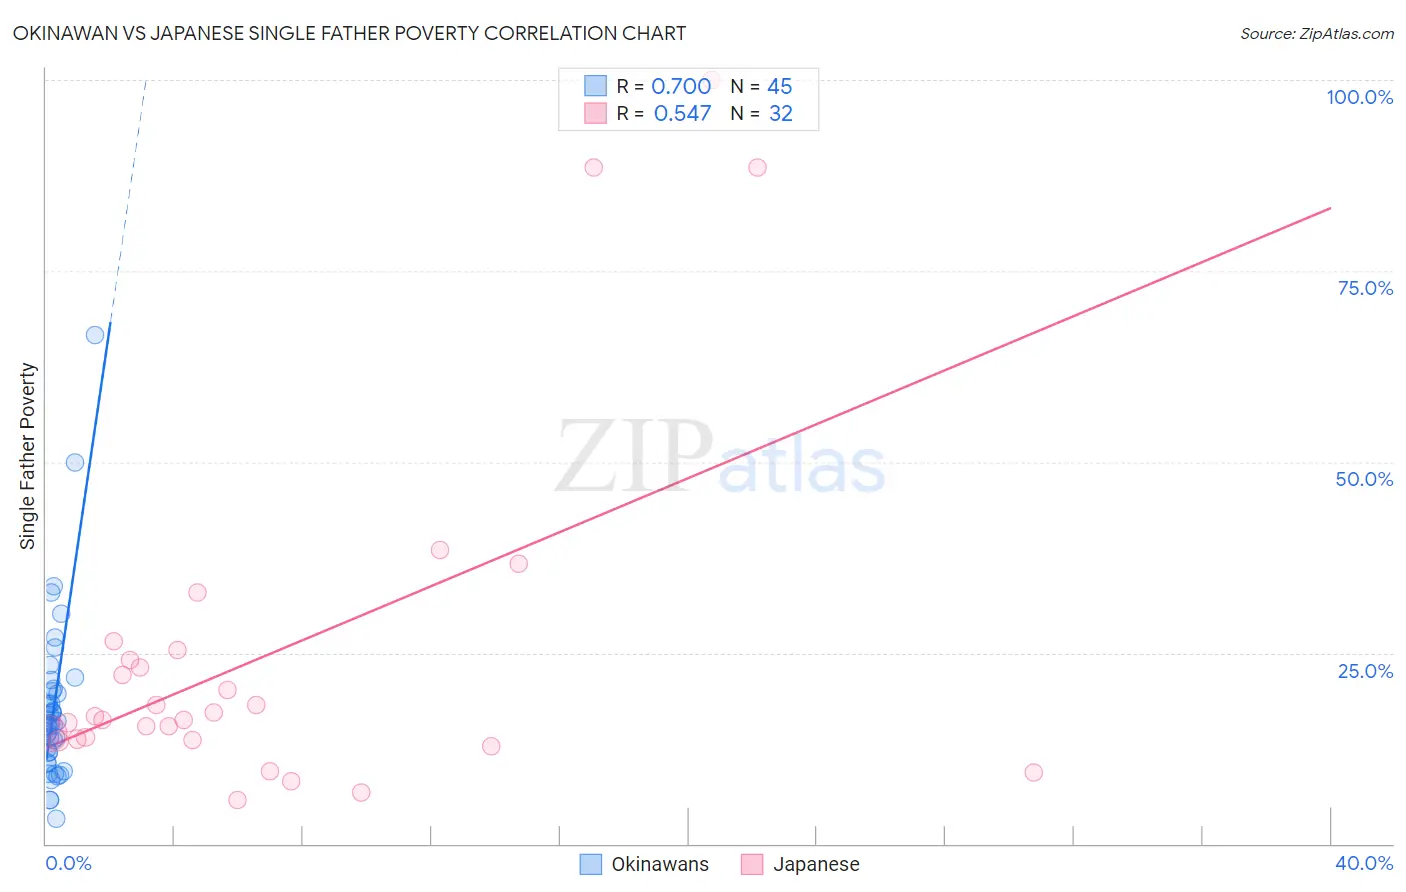
Okinawan vs Japanese Single Father Poverty Correlation Chart

The statistical analysis conducted on geographies consisting of 67,888,416 people shows a strong positive correlation between the proportion of Okinawans and poverty level among single fathers in the United States with a correlation coefficient (R) of 0.700 and weighted average of 14.6%. Similarly, the statistical analysis conducted on geographies consisting of 212,212,459 people shows a substantial positive correlation between the proportion of Japanese and poverty level among single fathers in the United States with a correlation coefficient (R) of 0.547 and weighted average of 15.2%, a difference of 4.1%.
Okinawan vs Japanese Single Father Poverty

Single Father Poverty Correlation Summary

MeasurementOkinawanJapanese
Minimum3.3%5.7%
Maximum66.7%100.0%
Range63.4%94.3%
Mean17.9%24.9%
Median15.8%16.5%
Interquartile 25% (IQ1)11.3%13.6%
Interquartile 75% (IQ3)20.1%24.7%
Interquartile Range (IQR)8.8%11.1%
Standard Deviation (Sample)11.2%23.4%
Standard Deviation (Population)11.1%23.1%

Similar Demographics by Single Father Poverty

Demographics Similar to Okinawans by Single Father Poverty

In terms of single father poverty, the demographic groups most similar to Okinawans are Egyptian (14.7%, a difference of 0.10%), Immigrants from Bolivia (14.7%, a difference of 0.17%), Immigrants from Indonesia (14.7%, a difference of 0.33%), Immigrants from Eastern Africa (14.7%, a difference of 0.46%), and Bolivian (14.7%, a difference of 0.47%).
DemographicsRating | RankSingle Father Poverty
Spanish American Indians
100.0
/100
|
#26
Exceptional
14.4%
Nepalese
100.0
/100
|
#27
Exceptional
14.4%
Immigrants | South Central Asia
100.0
/100
|
#28
Exceptional
14.5%
Somalis
100.0
/100
|
#29
Exceptional
14.5%
Thais
100.0
/100
|
#30
Exceptional
14.5%
Icelanders
100.0
/100
|
#31
Exceptional
14.5%
Asians
100.0
/100
|
#32
Exceptional
14.6%
Okinawans
100.0
/100
|
#33
Exceptional
14.6%
Egyptians
100.0
/100
|
#34
Exceptional
14.7%
Immigrants | Bolivia
100.0
/100
|
#35
Exceptional
14.7%
Immigrants | Indonesia
100.0
/100
|
#36
Exceptional
14.7%
Immigrants | Eastern Africa
100.0
/100
|
#37
Exceptional
14.7%
Bolivians
100.0
/100
|
#38
Exceptional
14.7%
Immigrants | Asia
100.0
/100
|
#39
Exceptional
14.7%
Pima
100.0
/100
|
#40
Exceptional
14.8%

Demographics Similar to Japanese by Single Father Poverty

In terms of single father poverty, the demographic groups most similar to Japanese are Immigrants from Cameroon (15.2%, a difference of 0.030%), Mongolian (15.3%, a difference of 0.10%), Paraguayan (15.2%, a difference of 0.11%), Immigrants from Moldova (15.2%, a difference of 0.20%), and Immigrants from Malaysia (15.2%, a difference of 0.23%).
DemographicsRating | RankSingle Father Poverty
Immigrants | Armenia
99.8
/100
|
#62
Exceptional
15.2%
Immigrants | Sweden
99.8
/100
|
#63
Exceptional
15.2%
Bangladeshis
99.8
/100
|
#64
Exceptional
15.2%
Immigrants | Malaysia
99.8
/100
|
#65
Exceptional
15.2%
Immigrants | Moldova
99.8
/100
|
#66
Exceptional
15.2%
Paraguayans
99.7
/100
|
#67
Exceptional
15.2%
Immigrants | Cameroon
99.7
/100
|
#68
Exceptional
15.2%
Japanese
99.7
/100
|
#69
Exceptional
15.2%
Mongolians
99.7
/100
|
#70
Exceptional
15.3%
Immigrants | Brazil
99.6
/100
|
#71
Exceptional
15.3%
Immigrants | Lithuania
99.6
/100
|
#72
Exceptional
15.3%
Kenyans
99.6
/100
|
#73
Exceptional
15.3%
Maltese
99.6
/100
|
#74
Exceptional
15.3%
Immigrants | Turkey
99.5
/100
|
#75
Exceptional
15.3%
Immigrants | Japan
99.5
/100
|
#76
Exceptional
15.3%