Okinawan vs Immigrants from Zimbabwe College, Under 1 year
COMPARE
Okinawan
Immigrants from Zimbabwe
College, Under 1 year
College, Under 1 year Comparison
Okinawans
Immigrants from Zimbabwe
73.7%
COLLEGE, UNDER 1 YEAR
100.0/ 100
METRIC RATING
7th/ 347
METRIC RANK
68.9%
COLLEGE, UNDER 1 YEAR
99.2/ 100
METRIC RATING
67th/ 347
METRIC RANK
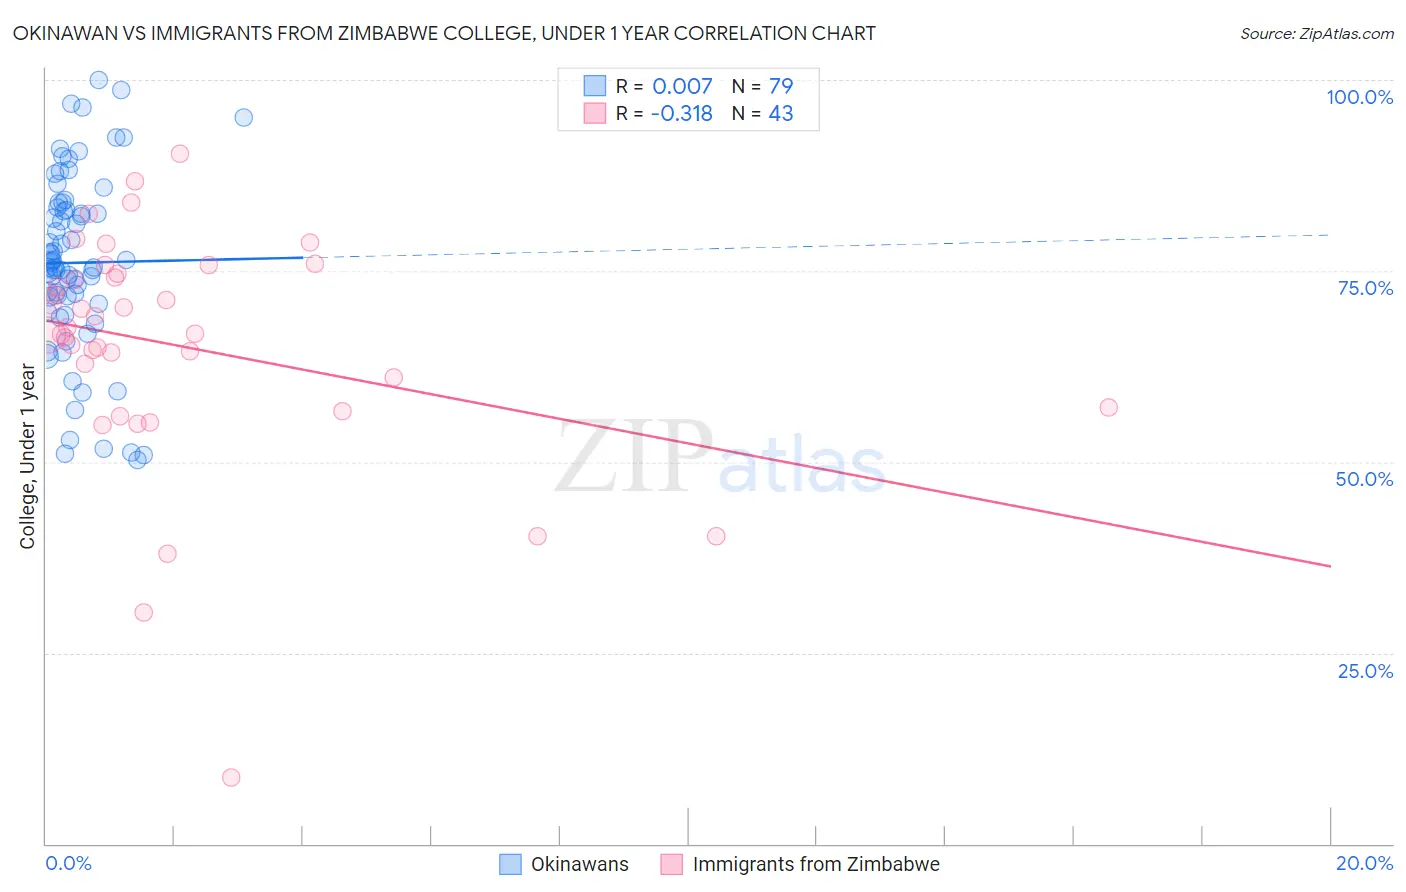
Okinawan vs Immigrants from Zimbabwe College, Under 1 year Correlation Chart
The statistical analysis conducted on geographies consisting of 73,779,368 people shows no correlation between the proportion of Okinawans and percentage of population with at least college, under 1 year education in the United States with a correlation coefficient (R) of 0.007 and weighted average of 73.7%. Similarly, the statistical analysis conducted on geographies consisting of 117,809,691 people shows a mild negative correlation between the proportion of Immigrants from Zimbabwe and percentage of population with at least college, under 1 year education in the United States with a correlation coefficient (R) of -0.318 and weighted average of 68.9%, a difference of 6.9%.
College, Under 1 year Correlation Summary
| Measurement | Okinawan | Immigrants from Zimbabwe |
| Minimum | 50.3% | 8.7% |
| Maximum | 100.0% | 90.4% |
| Range | 49.7% | 81.8% |
| Mean | 76.1% | 65.1% |
| Median | 75.5% | 66.7% |
| Interquartile 25% (IQ1) | 70.6% | 57.1% |
| Interquartile 75% (IQ3) | 83.3% | 74.7% |
| Interquartile Range (IQR) | 12.7% | 17.5% |
| Standard Deviation (Sample) | 11.7% | 15.5% |
| Standard Deviation (Population) | 11.7% | 15.3% |
Similar Demographics by College, Under 1 year
Demographics Similar to Okinawans by College, Under 1 year
In terms of college, under 1 year, the demographic groups most similar to Okinawans are Thai (73.4%, a difference of 0.33%), Immigrants from Taiwan (74.2%, a difference of 0.70%), Immigrants from Iran (74.3%, a difference of 0.80%), Immigrants from India (74.4%, a difference of 1.0%), and Immigrants from Australia (72.7%, a difference of 1.3%).
| Demographics | Rating | Rank | College, Under 1 year |
| Filipinos | 100.0 /100 | #1 | Exceptional 75.5% |
| Iranians | 100.0 /100 | #2 | Exceptional 74.9% |
| Immigrants | Singapore | 100.0 /100 | #3 | Exceptional 74.8% |
| Immigrants | India | 100.0 /100 | #4 | Exceptional 74.4% |
| Immigrants | Iran | 100.0 /100 | #5 | Exceptional 74.3% |
| Immigrants | Taiwan | 100.0 /100 | #6 | Exceptional 74.2% |
| Okinawans | 100.0 /100 | #7 | Exceptional 73.7% |
| Thais | 100.0 /100 | #8 | Exceptional 73.4% |
| Immigrants | Australia | 100.0 /100 | #9 | Exceptional 72.7% |
| Immigrants | Israel | 100.0 /100 | #10 | Exceptional 72.3% |
| Immigrants | South Central Asia | 100.0 /100 | #11 | Exceptional 72.1% |
| Immigrants | Sweden | 100.0 /100 | #12 | Exceptional 72.1% |
| Cypriots | 100.0 /100 | #13 | Exceptional 72.0% |
| Cambodians | 100.0 /100 | #14 | Exceptional 71.9% |
| Burmese | 100.0 /100 | #15 | Exceptional 71.9% |
Demographics Similar to Immigrants from Zimbabwe by College, Under 1 year
In terms of college, under 1 year, the demographic groups most similar to Immigrants from Zimbabwe are Immigrants from Indonesia (68.9%, a difference of 0.030%), Immigrants from Romania (68.9%, a difference of 0.050%), Immigrants from North America (69.0%, a difference of 0.14%), Immigrants from Moldova (69.0%, a difference of 0.17%), and Northern European (69.0%, a difference of 0.18%).
| Demographics | Rating | Rank | College, Under 1 year |
| Immigrants | Asia | 99.5 /100 | #60 | Exceptional 69.2% |
| Immigrants | Kazakhstan | 99.5 /100 | #61 | Exceptional 69.2% |
| Immigrants | Belarus | 99.5 /100 | #62 | Exceptional 69.2% |
| Immigrants | Canada | 99.4 /100 | #63 | Exceptional 69.1% |
| Northern Europeans | 99.4 /100 | #64 | Exceptional 69.0% |
| Immigrants | Moldova | 99.3 /100 | #65 | Exceptional 69.0% |
| Immigrants | North America | 99.3 /100 | #66 | Exceptional 69.0% |
| Immigrants | Zimbabwe | 99.2 /100 | #67 | Exceptional 68.9% |
| Immigrants | Indonesia | 99.2 /100 | #68 | Exceptional 68.9% |
| Immigrants | Romania | 99.2 /100 | #69 | Exceptional 68.9% |
| Lithuanians | 99.1 /100 | #70 | Exceptional 68.8% |
| Immigrants | Europe | 99.1 /100 | #71 | Exceptional 68.8% |
| Bolivians | 99.0 /100 | #72 | Exceptional 68.7% |
| Immigrants | England | 99.0 /100 | #73 | Exceptional 68.7% |
| Swedes | 98.9 /100 | #74 | Exceptional 68.7% |