Okinawan vs Native/Alaskan Single Father Poverty
COMPARE
Okinawan
Native/Alaskan
Single Father Poverty
Single Father Poverty Comparison
Okinawans
Natives/Alaskans
14.6%
SINGLE FATHER POVERTY
100.0/ 100
METRIC RATING
33rd/ 347
METRIC RANK
22.4%
SINGLE FATHER POVERTY
0.0/ 100
METRIC RATING
333rd/ 347
METRIC RANK
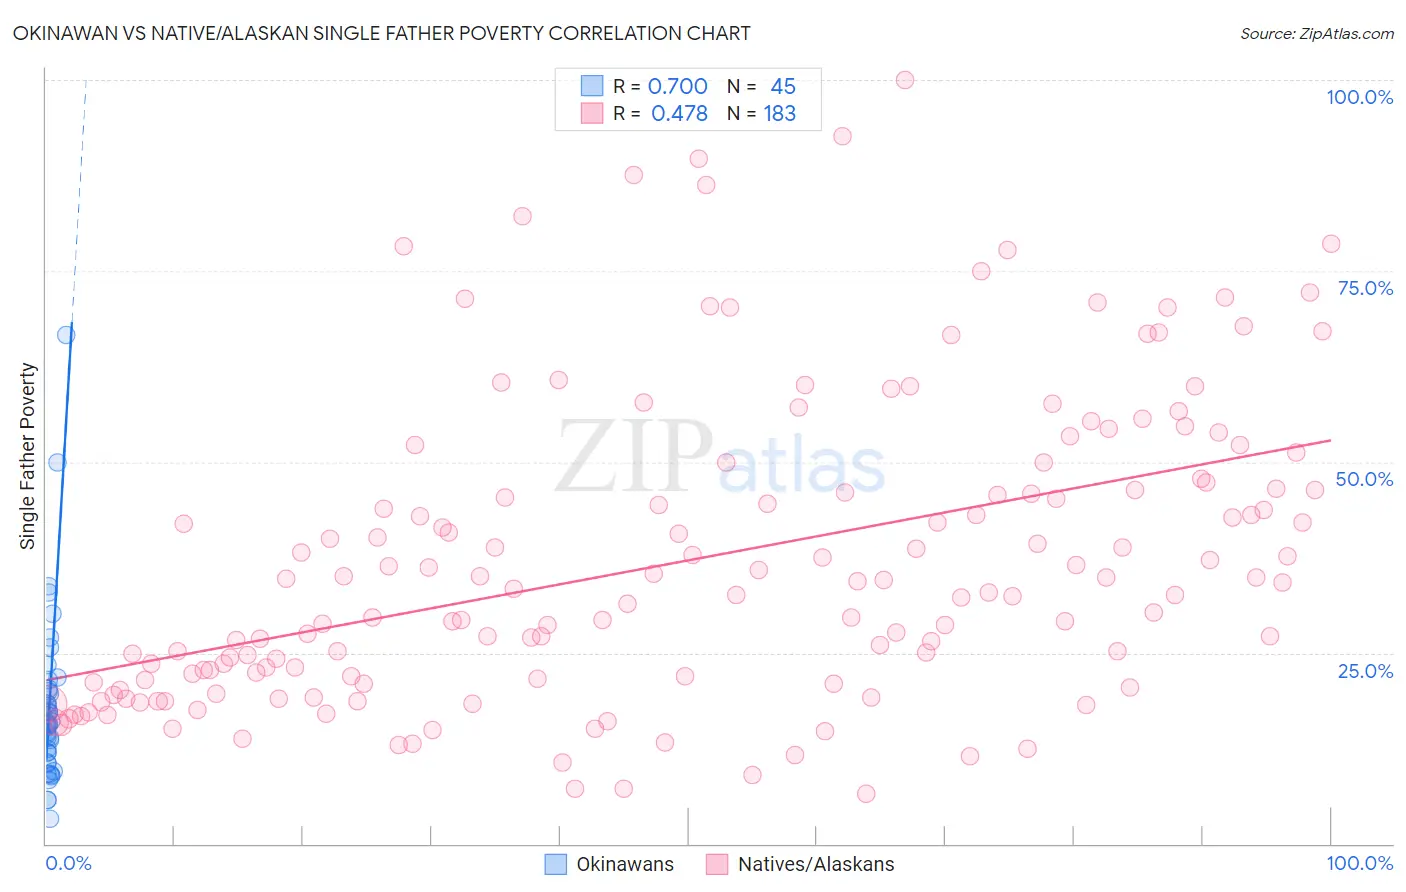
Okinawan vs Native/Alaskan Single Father Poverty Correlation Chart
The statistical analysis conducted on geographies consisting of 67,888,416 people shows a strong positive correlation between the proportion of Okinawans and poverty level among single fathers in the United States with a correlation coefficient (R) of 0.700 and weighted average of 14.6%. Similarly, the statistical analysis conducted on geographies consisting of 389,194,675 people shows a moderate positive correlation between the proportion of Natives/Alaskans and poverty level among single fathers in the United States with a correlation coefficient (R) of 0.478 and weighted average of 22.4%, a difference of 52.9%.
Single Father Poverty Correlation Summary
| Measurement | Okinawan | Native/Alaskan |
| Minimum | 3.3% | 6.5% |
| Maximum | 66.7% | 100.0% |
| Range | 63.4% | 93.5% |
| Mean | 17.9% | 37.0% |
| Median | 15.8% | 33.3% |
| Interquartile 25% (IQ1) | 11.3% | 21.4% |
| Interquartile 75% (IQ3) | 20.1% | 46.5% |
| Interquartile Range (IQR) | 8.8% | 25.1% |
| Standard Deviation (Sample) | 11.2% | 19.7% |
| Standard Deviation (Population) | 11.1% | 19.7% |
Similar Demographics by Single Father Poverty
Demographics Similar to Okinawans by Single Father Poverty
In terms of single father poverty, the demographic groups most similar to Okinawans are Egyptian (14.7%, a difference of 0.10%), Immigrants from Bolivia (14.7%, a difference of 0.17%), Immigrants from Indonesia (14.7%, a difference of 0.33%), Immigrants from Eastern Africa (14.7%, a difference of 0.46%), and Bolivian (14.7%, a difference of 0.47%).
| Demographics | Rating | Rank | Single Father Poverty |
| Spanish American Indians | 100.0 /100 | #26 | Exceptional 14.4% |
| Nepalese | 100.0 /100 | #27 | Exceptional 14.4% |
| Immigrants | South Central Asia | 100.0 /100 | #28 | Exceptional 14.5% |
| Somalis | 100.0 /100 | #29 | Exceptional 14.5% |
| Thais | 100.0 /100 | #30 | Exceptional 14.5% |
| Icelanders | 100.0 /100 | #31 | Exceptional 14.5% |
| Asians | 100.0 /100 | #32 | Exceptional 14.6% |
| Okinawans | 100.0 /100 | #33 | Exceptional 14.6% |
| Egyptians | 100.0 /100 | #34 | Exceptional 14.7% |
| Immigrants | Bolivia | 100.0 /100 | #35 | Exceptional 14.7% |
| Immigrants | Indonesia | 100.0 /100 | #36 | Exceptional 14.7% |
| Immigrants | Eastern Africa | 100.0 /100 | #37 | Exceptional 14.7% |
| Bolivians | 100.0 /100 | #38 | Exceptional 14.7% |
| Immigrants | Asia | 100.0 /100 | #39 | Exceptional 14.7% |
| Pima | 100.0 /100 | #40 | Exceptional 14.8% |
Demographics Similar to Natives/Alaskans by Single Father Poverty
In terms of single father poverty, the demographic groups most similar to Natives/Alaskans are Kiowa (22.5%, a difference of 0.36%), Tohono O'odham (22.0%, a difference of 1.7%), Shoshone (22.9%, a difference of 2.3%), Cajun (23.1%, a difference of 3.0%), and Central American Indian (21.7%, a difference of 3.3%).
| Demographics | Rating | Rank | Single Father Poverty |
| Immigrants | Yemen | 0.0 /100 | #326 | Tragic 20.6% |
| Choctaw | 0.0 /100 | #327 | Tragic 20.7% |
| Pueblo | 0.0 /100 | #328 | Tragic 21.1% |
| Colville | 0.0 /100 | #329 | Tragic 21.4% |
| Paiute | 0.0 /100 | #330 | Tragic 21.6% |
| Central American Indians | 0.0 /100 | #331 | Tragic 21.7% |
| Tohono O'odham | 0.0 /100 | #332 | Tragic 22.0% |
| Natives/Alaskans | 0.0 /100 | #333 | Tragic 22.4% |
| Kiowa | 0.0 /100 | #334 | Tragic 22.5% |
| Shoshone | 0.0 /100 | #335 | Tragic 22.9% |
| Cajuns | 0.0 /100 | #336 | Tragic 23.1% |
| Sioux | 0.0 /100 | #337 | Tragic 23.9% |
| Arapaho | 0.0 /100 | #338 | Tragic 24.0% |
| Apache | 0.0 /100 | #339 | Tragic 24.2% |
| Houma | 0.0 /100 | #340 | Tragic 26.7% |