Choctaw vs Immigrants from Zimbabwe Single Father Poverty
COMPARE
Choctaw
Immigrants from Zimbabwe
Single Father Poverty
Single Father Poverty Comparison
Choctaw
Immigrants from Zimbabwe
20.7%
SINGLE FATHER POVERTY
0.0/ 100
METRIC RATING
327th/ 347
METRIC RANK
16.1%
SINGLE FATHER POVERTY
72.1/ 100
METRIC RATING
152nd/ 347
METRIC RANK
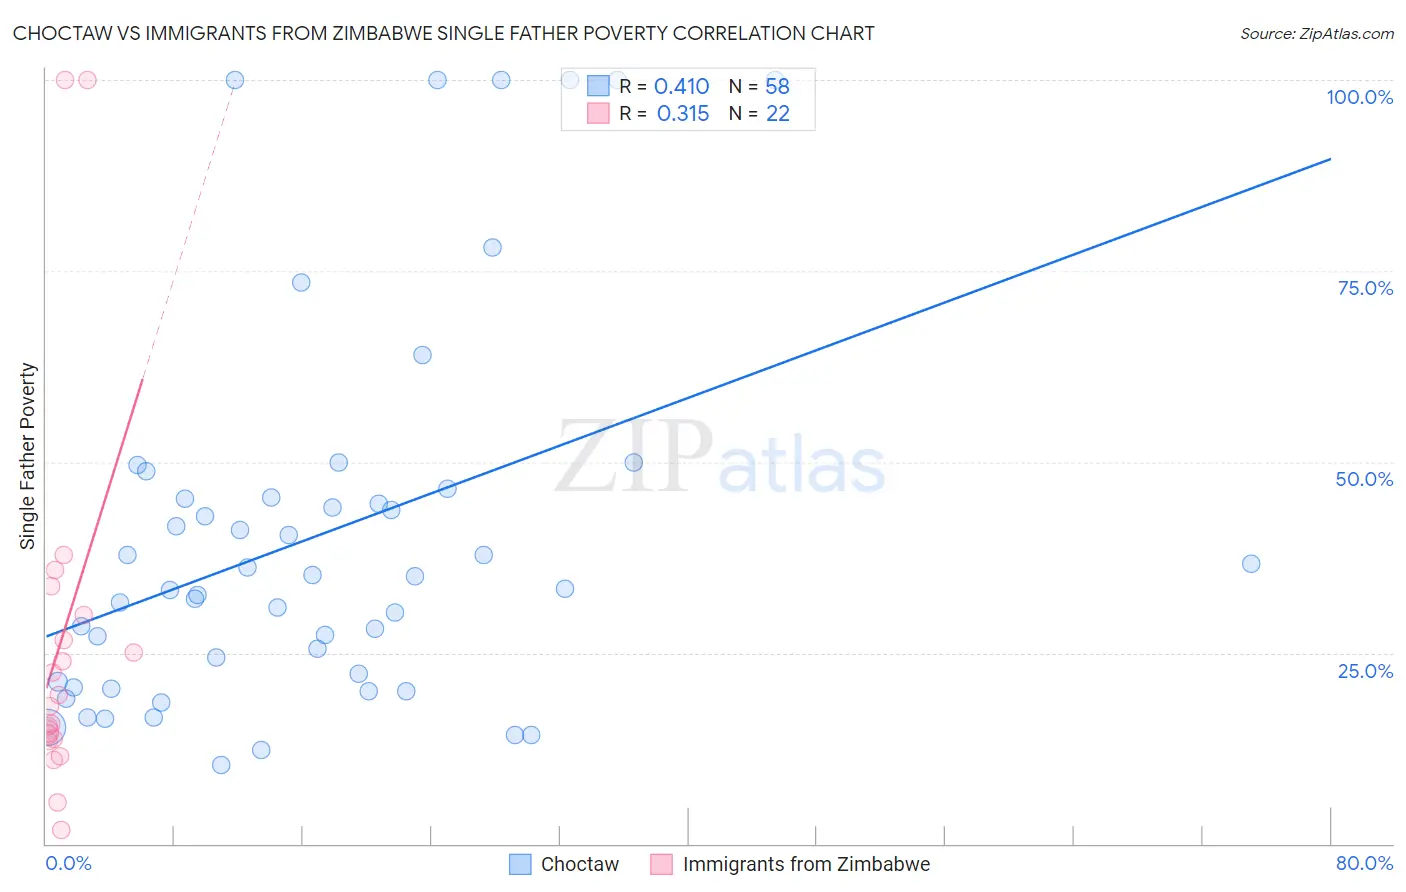
Choctaw vs Immigrants from Zimbabwe Single Father Poverty Correlation Chart
The statistical analysis conducted on geographies consisting of 228,054,527 people shows a moderate positive correlation between the proportion of Choctaw and poverty level among single fathers in the United States with a correlation coefficient (R) of 0.410 and weighted average of 20.7%. Similarly, the statistical analysis conducted on geographies consisting of 105,577,503 people shows a mild positive correlation between the proportion of Immigrants from Zimbabwe and poverty level among single fathers in the United States with a correlation coefficient (R) of 0.315 and weighted average of 16.1%, a difference of 28.5%.
Single Father Poverty Correlation Summary
| Measurement | Choctaw | Immigrants from Zimbabwe |
| Minimum | 10.3% | 1.8% |
| Maximum | 100.0% | 100.0% |
| Range | 89.7% | 98.2% |
| Mean | 40.2% | 26.8% |
| Median | 34.2% | 18.8% |
| Interquartile 25% (IQ1) | 21.2% | 13.8% |
| Interquartile 75% (IQ3) | 45.3% | 30.0% |
| Interquartile Range (IQR) | 24.1% | 16.2% |
| Standard Deviation (Sample) | 24.9% | 25.5% |
| Standard Deviation (Population) | 24.7% | 24.9% |
Similar Demographics by Single Father Poverty
Demographics Similar to Choctaw by Single Father Poverty
In terms of single father poverty, the demographic groups most similar to Choctaw are Immigrants from Yemen (20.6%, a difference of 0.69%), Black/African American (20.4%, a difference of 1.7%), Pueblo (21.1%, a difference of 1.9%), Colville (21.4%, a difference of 3.0%), and American (20.1%, a difference of 3.3%).
| Demographics | Rating | Rank | Single Father Poverty |
| Inupiat | 0.0 /100 | #320 | Tragic 19.5% |
| Cherokee | 0.0 /100 | #321 | Tragic 19.6% |
| Creek | 0.0 /100 | #322 | Tragic 19.8% |
| Pennsylvania Germans | 0.0 /100 | #323 | Tragic 20.0% |
| Americans | 0.0 /100 | #324 | Tragic 20.1% |
| Blacks/African Americans | 0.0 /100 | #325 | Tragic 20.4% |
| Immigrants | Yemen | 0.0 /100 | #326 | Tragic 20.6% |
| Choctaw | 0.0 /100 | #327 | Tragic 20.7% |
| Pueblo | 0.0 /100 | #328 | Tragic 21.1% |
| Colville | 0.0 /100 | #329 | Tragic 21.4% |
| Paiute | 0.0 /100 | #330 | Tragic 21.6% |
| Central American Indians | 0.0 /100 | #331 | Tragic 21.7% |
| Tohono O'odham | 0.0 /100 | #332 | Tragic 22.0% |
| Natives/Alaskans | 0.0 /100 | #333 | Tragic 22.4% |
| Kiowa | 0.0 /100 | #334 | Tragic 22.5% |
Demographics Similar to Immigrants from Zimbabwe by Single Father Poverty
In terms of single father poverty, the demographic groups most similar to Immigrants from Zimbabwe are Immigrants from Israel (16.1%, a difference of 0.0%), Immigrants from France (16.1%, a difference of 0.060%), Mexican (16.1%, a difference of 0.10%), Jordanian (16.1%, a difference of 0.12%), and South African (16.1%, a difference of 0.18%).
| Demographics | Rating | Rank | Single Father Poverty |
| Immigrants | Western Asia | 80.7 /100 | #145 | Excellent 16.0% |
| Immigrants | Hungary | 78.3 /100 | #146 | Good 16.1% |
| Colombians | 77.1 /100 | #147 | Good 16.1% |
| Nigerians | 76.8 /100 | #148 | Good 16.1% |
| South Africans | 75.1 /100 | #149 | Good 16.1% |
| Jordanians | 74.2 /100 | #150 | Good 16.1% |
| Immigrants | France | 73.1 /100 | #151 | Good 16.1% |
| Immigrants | Zimbabwe | 72.1 /100 | #152 | Good 16.1% |
| Immigrants | Israel | 72.0 /100 | #153 | Good 16.1% |
| Mexicans | 70.1 /100 | #154 | Good 16.1% |
| Immigrants | Nicaragua | 67.8 /100 | #155 | Good 16.2% |
| Immigrants | Jordan | 66.0 /100 | #156 | Good 16.2% |
| Immigrants | Czechoslovakia | 62.8 /100 | #157 | Good 16.2% |
| Portuguese | 62.3 /100 | #158 | Good 16.2% |
| Belizeans | 59.9 /100 | #159 | Average 16.2% |