Okinawan vs Immigrants from Northern Europe Single Father Poverty
COMPARE
Okinawan
Immigrants from Northern Europe
Single Father Poverty
Single Father Poverty Comparison
Okinawans
Immigrants from Northern Europe
14.6%
SINGLE FATHER POVERTY
100.0/ 100
METRIC RATING
33rd/ 347
METRIC RANK
16.5%
SINGLE FATHER POVERTY
20.3/ 100
METRIC RATING
197th/ 347
METRIC RANK
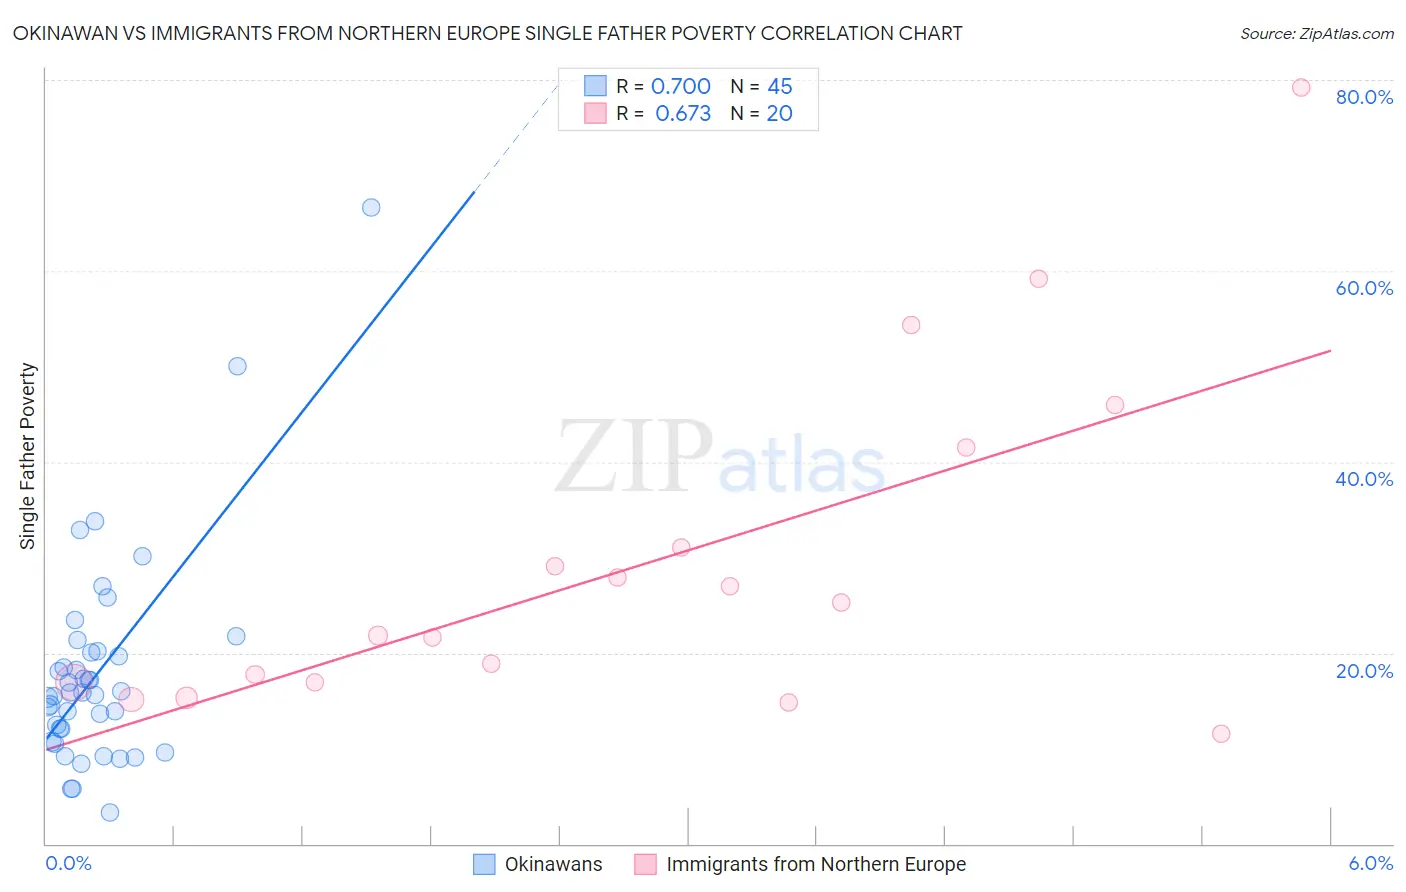
Okinawan vs Immigrants from Northern Europe Single Father Poverty Correlation Chart
The statistical analysis conducted on geographies consisting of 67,888,416 people shows a strong positive correlation between the proportion of Okinawans and poverty level among single fathers in the United States with a correlation coefficient (R) of 0.700 and weighted average of 14.6%. Similarly, the statistical analysis conducted on geographies consisting of 359,106,095 people shows a significant positive correlation between the proportion of Immigrants from Northern Europe and poverty level among single fathers in the United States with a correlation coefficient (R) of 0.673 and weighted average of 16.5%, a difference of 13.0%.
Single Father Poverty Correlation Summary
| Measurement | Okinawan | Immigrants from Northern Europe |
| Minimum | 3.3% | 11.5% |
| Maximum | 66.7% | 79.2% |
| Range | 63.4% | 67.7% |
| Mean | 17.9% | 29.5% |
| Median | 15.8% | 23.6% |
| Interquartile 25% (IQ1) | 11.3% | 16.9% |
| Interquartile 75% (IQ3) | 20.1% | 36.3% |
| Interquartile Range (IQR) | 8.8% | 19.4% |
| Standard Deviation (Sample) | 11.2% | 17.8% |
| Standard Deviation (Population) | 11.1% | 17.4% |
Similar Demographics by Single Father Poverty
Demographics Similar to Okinawans by Single Father Poverty
In terms of single father poverty, the demographic groups most similar to Okinawans are Egyptian (14.7%, a difference of 0.10%), Immigrants from Bolivia (14.7%, a difference of 0.17%), Immigrants from Indonesia (14.7%, a difference of 0.33%), Immigrants from Eastern Africa (14.7%, a difference of 0.46%), and Bolivian (14.7%, a difference of 0.47%).
| Demographics | Rating | Rank | Single Father Poverty |
| Spanish American Indians | 100.0 /100 | #26 | Exceptional 14.4% |
| Nepalese | 100.0 /100 | #27 | Exceptional 14.4% |
| Immigrants | South Central Asia | 100.0 /100 | #28 | Exceptional 14.5% |
| Somalis | 100.0 /100 | #29 | Exceptional 14.5% |
| Thais | 100.0 /100 | #30 | Exceptional 14.5% |
| Icelanders | 100.0 /100 | #31 | Exceptional 14.5% |
| Asians | 100.0 /100 | #32 | Exceptional 14.6% |
| Okinawans | 100.0 /100 | #33 | Exceptional 14.6% |
| Egyptians | 100.0 /100 | #34 | Exceptional 14.7% |
| Immigrants | Bolivia | 100.0 /100 | #35 | Exceptional 14.7% |
| Immigrants | Indonesia | 100.0 /100 | #36 | Exceptional 14.7% |
| Immigrants | Eastern Africa | 100.0 /100 | #37 | Exceptional 14.7% |
| Bolivians | 100.0 /100 | #38 | Exceptional 14.7% |
| Immigrants | Asia | 100.0 /100 | #39 | Exceptional 14.7% |
| Pima | 100.0 /100 | #40 | Exceptional 14.8% |
Demographics Similar to Immigrants from Northern Europe by Single Father Poverty
In terms of single father poverty, the demographic groups most similar to Immigrants from Northern Europe are Romanian (16.5%, a difference of 0.010%), Immigrants from Belize (16.5%, a difference of 0.030%), Immigrants from Canada (16.5%, a difference of 0.11%), Syrian (16.6%, a difference of 0.20%), and Cape Verdean (16.5%, a difference of 0.26%).
| Demographics | Rating | Rank | Single Father Poverty |
| Immigrants | Burma/Myanmar | 28.0 /100 | #190 | Fair 16.5% |
| Immigrants | Guyana | 27.1 /100 | #191 | Fair 16.5% |
| Immigrants | Switzerland | 24.8 /100 | #192 | Fair 16.5% |
| Ecuadorians | 24.5 /100 | #193 | Fair 16.5% |
| Cape Verdeans | 24.4 /100 | #194 | Fair 16.5% |
| Immigrants | Barbados | 24.3 /100 | #195 | Fair 16.5% |
| Immigrants | Canada | 21.9 /100 | #196 | Fair 16.5% |
| Immigrants | Northern Europe | 20.3 /100 | #197 | Fair 16.5% |
| Romanians | 20.1 /100 | #198 | Fair 16.5% |
| Immigrants | Belize | 19.8 /100 | #199 | Poor 16.5% |
| Syrians | 17.4 /100 | #200 | Poor 16.6% |
| Cubans | 16.5 /100 | #201 | Poor 16.6% |
| Immigrants | Croatia | 16.5 /100 | #202 | Poor 16.6% |
| Immigrants | North America | 15.1 /100 | #203 | Poor 16.6% |
| Immigrants | Guatemala | 14.8 /100 | #204 | Poor 16.6% |