Okinawan vs Immigrants from Zimbabwe Median Household Income
COMPARE
Okinawan
Immigrants from Zimbabwe
Median Household Income
Median Household Income Comparison
Okinawans
Immigrants from Zimbabwe
$106,624
MEDIAN HOUSEHOLD INCOME
100.0/ 100
METRIC RATING
9th/ 347
METRIC RANK
$89,496
MEDIAN HOUSEHOLD INCOME
94.4/ 100
METRIC RATING
123rd/ 347
METRIC RANK
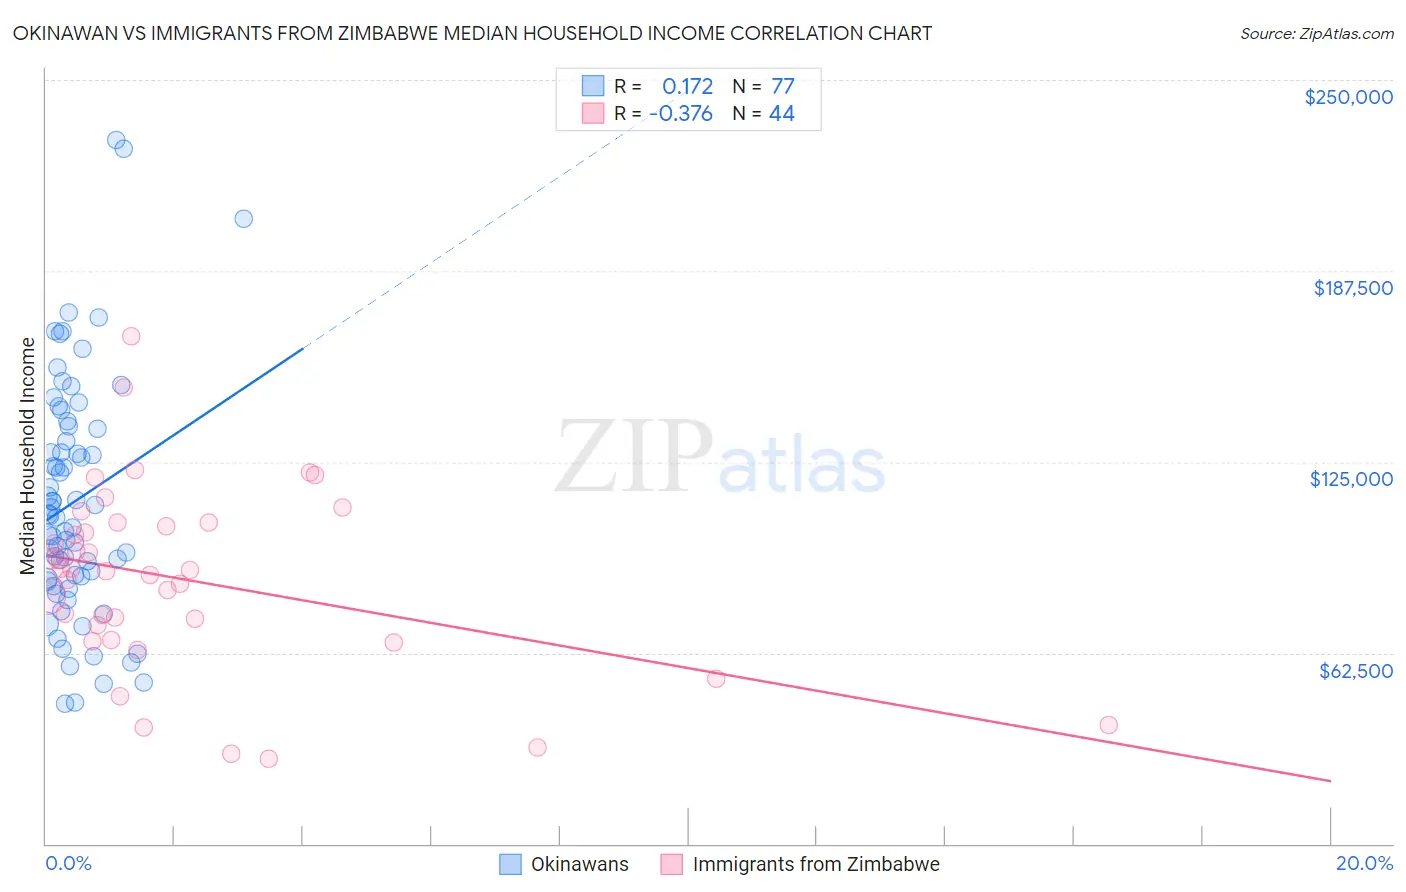
Okinawan vs Immigrants from Zimbabwe Median Household Income Correlation Chart
The statistical analysis conducted on geographies consisting of 73,710,958 people shows a poor positive correlation between the proportion of Okinawans and median household income in the United States with a correlation coefficient (R) of 0.172 and weighted average of $106,624. Similarly, the statistical analysis conducted on geographies consisting of 117,782,867 people shows a mild negative correlation between the proportion of Immigrants from Zimbabwe and median household income in the United States with a correlation coefficient (R) of -0.376 and weighted average of $89,496, a difference of 19.1%.
Median Household Income Correlation Summary
| Measurement | Okinawan | Immigrants from Zimbabwe |
| Minimum | $46,026 | $27,656 |
| Maximum | $230,434 | $166,303 |
| Range | $184,408 | $138,647 |
| Mean | $112,091 | $86,538 |
| Median | $107,483 | $89,467 |
| Interquartile 25% (IQ1) | $86,369 | $69,146 |
| Interquartile 75% (IQ3) | $136,400 | $104,418 |
| Interquartile Range (IQR) | $50,031 | $35,272 |
| Standard Deviation (Sample) | $39,077 | $29,812 |
| Standard Deviation (Population) | $38,823 | $29,471 |
Similar Demographics by Median Household Income
Demographics Similar to Okinawans by Median Household Income
In terms of median household income, the demographic groups most similar to Okinawans are Immigrants from South Central Asia ($106,057, a difference of 0.53%), Immigrants from China ($105,335, a difference of 1.2%), Indian (Asian) ($105,262, a difference of 1.3%), Immigrants from Iran ($108,055, a difference of 1.3%), and Immigrants from Eastern Asia ($104,796, a difference of 1.7%).
| Demographics | Rating | Rank | Median Household Income |
| Filipinos | 100.0 /100 | #2 | Exceptional $115,509 |
| Immigrants | India | 100.0 /100 | #3 | Exceptional $113,009 |
| Immigrants | Hong Kong | 100.0 /100 | #4 | Exceptional $111,519 |
| Thais | 100.0 /100 | #5 | Exceptional $110,648 |
| Immigrants | Singapore | 100.0 /100 | #6 | Exceptional $110,428 |
| Iranians | 100.0 /100 | #7 | Exceptional $109,835 |
| Immigrants | Iran | 100.0 /100 | #8 | Exceptional $108,055 |
| Okinawans | 100.0 /100 | #9 | Exceptional $106,624 |
| Immigrants | South Central Asia | 100.0 /100 | #10 | Exceptional $106,057 |
| Immigrants | China | 100.0 /100 | #11 | Exceptional $105,335 |
| Indians (Asian) | 100.0 /100 | #12 | Exceptional $105,262 |
| Immigrants | Eastern Asia | 100.0 /100 | #13 | Exceptional $104,796 |
| Immigrants | Ireland | 100.0 /100 | #14 | Exceptional $104,692 |
| Immigrants | Israel | 100.0 /100 | #15 | Exceptional $104,090 |
| Burmese | 100.0 /100 | #16 | Exceptional $103,145 |
Demographics Similar to Immigrants from Zimbabwe by Median Household Income
In terms of median household income, the demographic groups most similar to Immigrants from Zimbabwe are Immigrants from Jordan ($89,412, a difference of 0.090%), Ethiopian ($89,640, a difference of 0.16%), Pakistani ($89,638, a difference of 0.16%), Immigrants from Kuwait ($89,263, a difference of 0.26%), and Immigrants from North Macedonia ($89,741, a difference of 0.27%).
| Demographics | Rating | Rank | Median Household Income |
| Native Hawaiians | 95.7 /100 | #116 | Exceptional $89,919 |
| Taiwanese | 95.6 /100 | #117 | Exceptional $89,900 |
| Syrians | 95.4 /100 | #118 | Exceptional $89,830 |
| Albanians | 95.2 /100 | #119 | Exceptional $89,744 |
| Immigrants | North Macedonia | 95.2 /100 | #120 | Exceptional $89,741 |
| Ethiopians | 94.9 /100 | #121 | Exceptional $89,640 |
| Pakistanis | 94.8 /100 | #122 | Exceptional $89,638 |
| Immigrants | Zimbabwe | 94.4 /100 | #123 | Exceptional $89,496 |
| Immigrants | Jordan | 94.1 /100 | #124 | Exceptional $89,412 |
| Immigrants | Kuwait | 93.5 /100 | #125 | Exceptional $89,263 |
| Immigrants | Oceania | 92.9 /100 | #126 | Exceptional $89,100 |
| Immigrants | Peru | 92.5 /100 | #127 | Exceptional $89,010 |
| Portuguese | 92.3 /100 | #128 | Exceptional $88,976 |
| Brazilians | 92.1 /100 | #129 | Exceptional $88,934 |
| British | 92.0 /100 | #130 | Exceptional $88,914 |