Belizean vs Immigrants from Zimbabwe Single Father Poverty
COMPARE
Belizean
Immigrants from Zimbabwe
Single Father Poverty
Single Father Poverty Comparison
Belizeans
Immigrants from Zimbabwe
16.2%
SINGLE FATHER POVERTY
59.9/ 100
METRIC RATING
159th/ 347
METRIC RANK
16.1%
SINGLE FATHER POVERTY
72.1/ 100
METRIC RATING
152nd/ 347
METRIC RANK
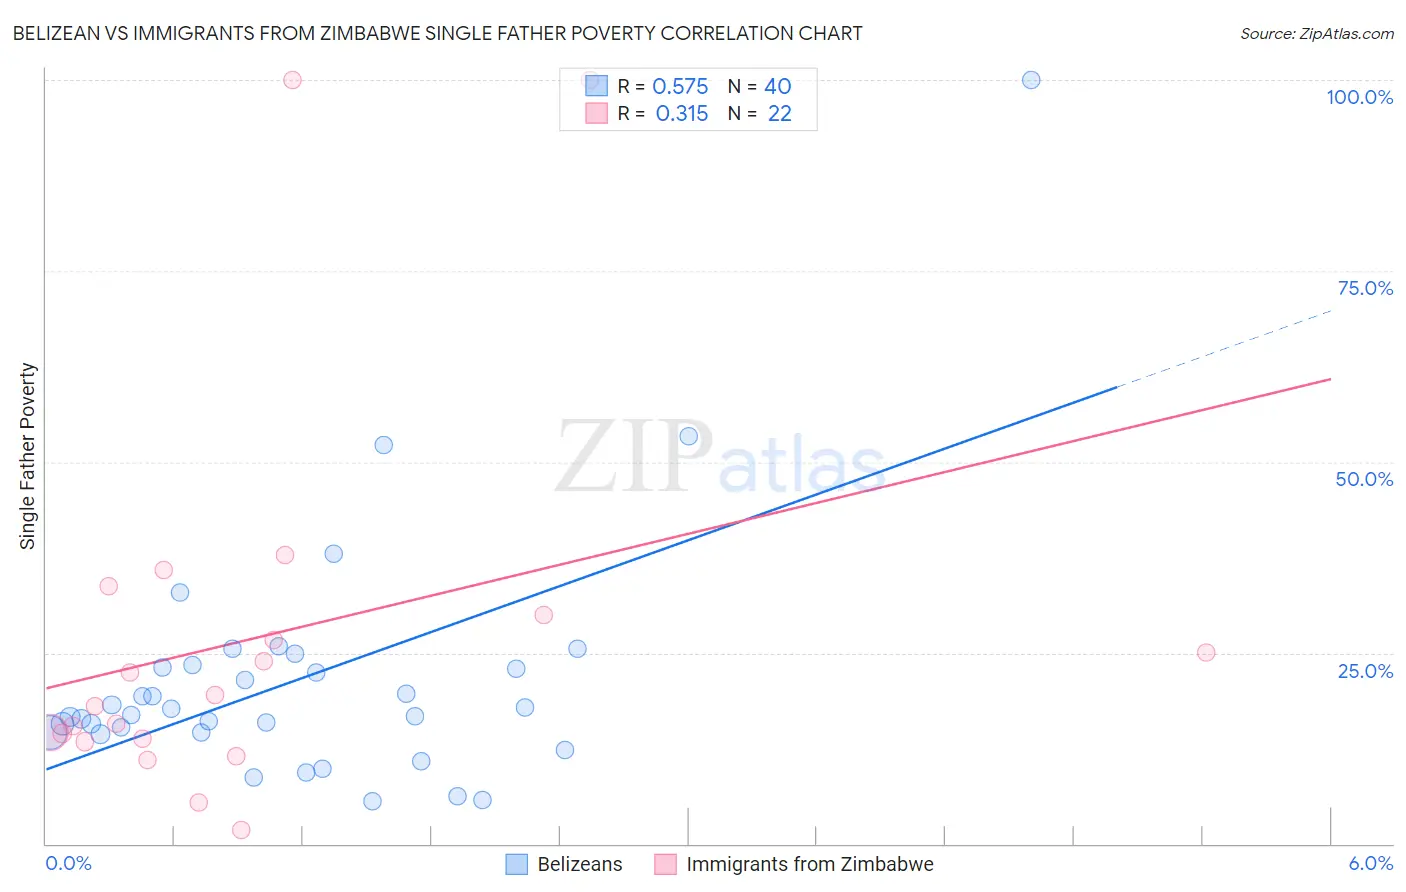
Belizean vs Immigrants from Zimbabwe Single Father Poverty Correlation Chart
The statistical analysis conducted on geographies consisting of 131,712,008 people shows a substantial positive correlation between the proportion of Belizeans and poverty level among single fathers in the United States with a correlation coefficient (R) of 0.575 and weighted average of 16.2%. Similarly, the statistical analysis conducted on geographies consisting of 105,577,503 people shows a mild positive correlation between the proportion of Immigrants from Zimbabwe and poverty level among single fathers in the United States with a correlation coefficient (R) of 0.315 and weighted average of 16.1%, a difference of 0.61%.
Single Father Poverty Correlation Summary
| Measurement | Belizean | Immigrants from Zimbabwe |
| Minimum | 5.6% | 1.8% |
| Maximum | 100.0% | 100.0% |
| Range | 94.4% | 98.2% |
| Mean | 21.5% | 26.8% |
| Median | 17.2% | 18.8% |
| Interquartile 25% (IQ1) | 14.5% | 13.8% |
| Interquartile 75% (IQ3) | 23.2% | 30.0% |
| Interquartile Range (IQR) | 8.7% | 16.2% |
| Standard Deviation (Sample) | 16.4% | 25.5% |
| Standard Deviation (Population) | 16.2% | 24.9% |
Demographics Similar to Belizeans and Immigrants from Zimbabwe by Single Father Poverty
In terms of single father poverty, the demographic groups most similar to Belizeans are Immigrants from Sudan (16.2%, a difference of 0.010%), Portuguese (16.2%, a difference of 0.11%), Immigrants from Czechoslovakia (16.2%, a difference of 0.14%), Estonian (16.2%, a difference of 0.15%), and Ugandan (16.3%, a difference of 0.18%). Similarly, the demographic groups most similar to Immigrants from Zimbabwe are Immigrants from Israel (16.1%, a difference of 0.0%), Immigrants from France (16.1%, a difference of 0.060%), Mexican (16.1%, a difference of 0.10%), Jordanian (16.1%, a difference of 0.12%), and South African (16.1%, a difference of 0.18%).
| Demographics | Rating | Rank | Single Father Poverty |
| Immigrants | Western Asia | 80.7 /100 | #145 | Excellent 16.0% |
| Immigrants | Hungary | 78.3 /100 | #146 | Good 16.1% |
| Colombians | 77.1 /100 | #147 | Good 16.1% |
| Nigerians | 76.8 /100 | #148 | Good 16.1% |
| South Africans | 75.1 /100 | #149 | Good 16.1% |
| Jordanians | 74.2 /100 | #150 | Good 16.1% |
| Immigrants | France | 73.1 /100 | #151 | Good 16.1% |
| Immigrants | Zimbabwe | 72.1 /100 | #152 | Good 16.1% |
| Immigrants | Israel | 72.0 /100 | #153 | Good 16.1% |
| Mexicans | 70.1 /100 | #154 | Good 16.1% |
| Immigrants | Nicaragua | 67.8 /100 | #155 | Good 16.2% |
| Immigrants | Jordan | 66.0 /100 | #156 | Good 16.2% |
| Immigrants | Czechoslovakia | 62.8 /100 | #157 | Good 16.2% |
| Portuguese | 62.3 /100 | #158 | Good 16.2% |
| Belizeans | 59.9 /100 | #159 | Average 16.2% |
| Immigrants | Sudan | 59.8 /100 | #160 | Average 16.2% |
| Estonians | 56.7 /100 | #161 | Average 16.2% |
| Ugandans | 55.9 /100 | #162 | Average 16.3% |
| Immigrants | Costa Rica | 55.7 /100 | #163 | Average 16.3% |
| Guyanese | 55.2 /100 | #164 | Average 16.3% |
| Immigrants | Bangladesh | 55.1 /100 | #165 | Average 16.3% |