Okinawan vs Immigrants from Zimbabwe No Vehicles in Household
COMPARE
Okinawan
Immigrants from Zimbabwe
No Vehicles in Household
No Vehicles in Household Comparison
Okinawans
Immigrants from Zimbabwe
14.1%
NO VEHICLES IN HOUSEHOLD
0.0/ 100
METRIC RATING
291st/ 347
METRIC RANK
9.9%
NO VEHICLES IN HOUSEHOLD
82.6/ 100
METRIC RATING
142nd/ 347
METRIC RANK
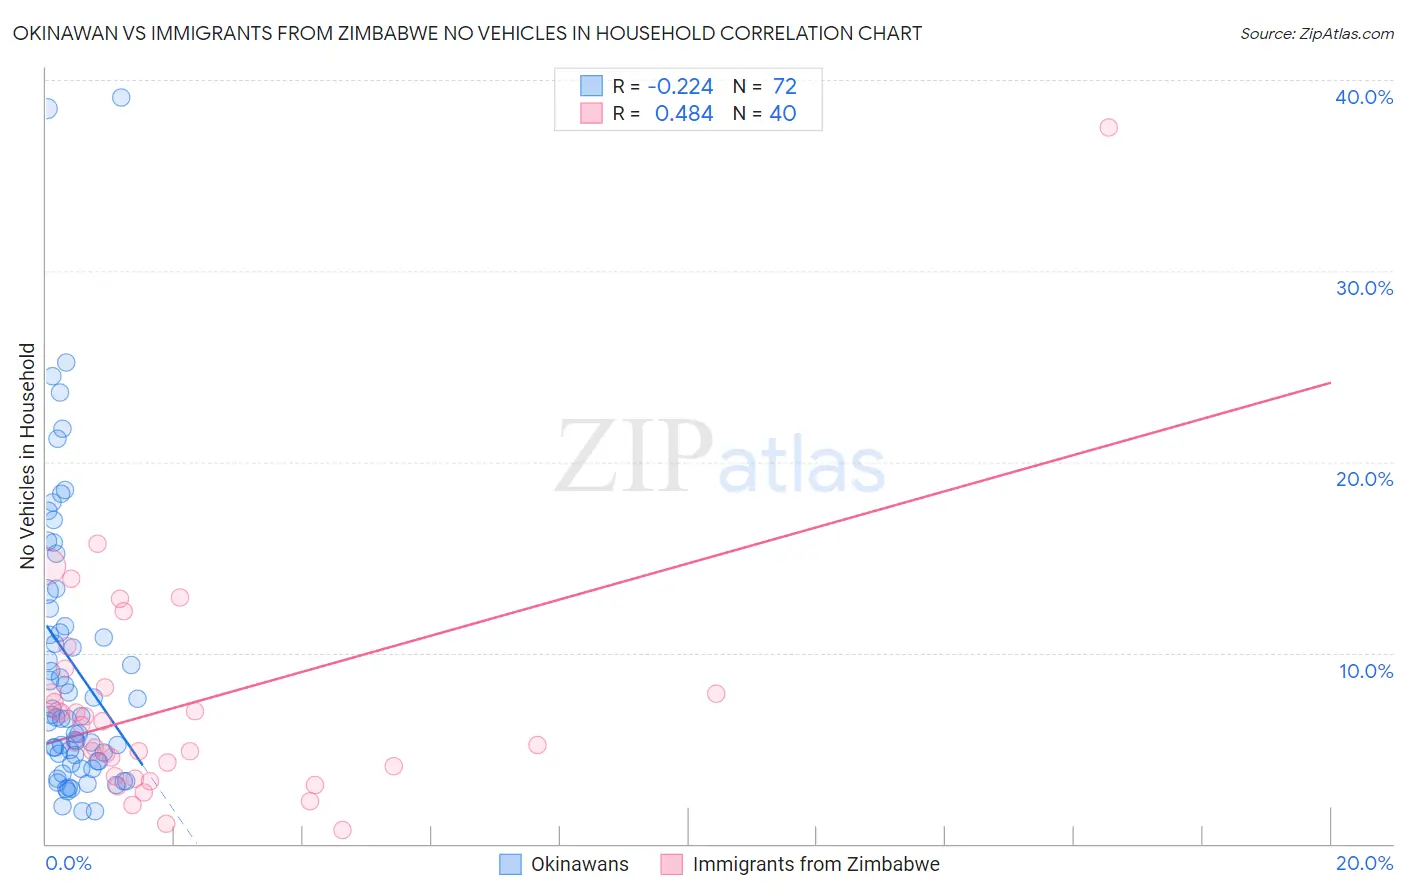
Okinawan vs Immigrants from Zimbabwe No Vehicles in Household Correlation Chart
The statistical analysis conducted on geographies consisting of 73,650,004 people shows a weak negative correlation between the proportion of Okinawans and percentage of households with no vehicle available in the United States with a correlation coefficient (R) of -0.224 and weighted average of 14.1%. Similarly, the statistical analysis conducted on geographies consisting of 117,693,810 people shows a moderate positive correlation between the proportion of Immigrants from Zimbabwe and percentage of households with no vehicle available in the United States with a correlation coefficient (R) of 0.484 and weighted average of 9.9%, a difference of 42.7%.
No Vehicles in Household Correlation Summary
| Measurement | Okinawan | Immigrants from Zimbabwe |
| Minimum | 1.7% | 0.74% |
| Maximum | 39.1% | 37.5% |
| Range | 37.3% | 36.8% |
| Mean | 9.5% | 7.2% |
| Median | 6.6% | 5.8% |
| Interquartile 25% (IQ1) | 4.3% | 3.8% |
| Interquartile 75% (IQ3) | 11.9% | 8.0% |
| Interquartile Range (IQR) | 7.5% | 4.2% |
| Standard Deviation (Sample) | 7.7% | 6.2% |
| Standard Deviation (Population) | 7.7% | 6.1% |
Similar Demographics by No Vehicles in Household
Demographics Similar to Okinawans by No Vehicles in Household
In terms of no vehicles in household, the demographic groups most similar to Okinawans are Indian (Asian) (14.1%, a difference of 0.0%), Pima (14.1%, a difference of 0.48%), Immigrants from Jamaica (14.2%, a difference of 1.1%), Immigrants from Australia (13.8%, a difference of 1.7%), and Belizean (14.3%, a difference of 1.9%).
| Demographics | Rating | Rank | No Vehicles in Household |
| Immigrants | Malaysia | 0.0 /100 | #284 | Tragic 13.6% |
| Immigrants | Eastern Europe | 0.0 /100 | #285 | Tragic 13.6% |
| Colville | 0.0 /100 | #286 | Tragic 13.7% |
| Immigrants | Ireland | 0.0 /100 | #287 | Tragic 13.7% |
| Hopi | 0.0 /100 | #288 | Tragic 13.7% |
| Immigrants | Australia | 0.0 /100 | #289 | Tragic 13.8% |
| Indians (Asian) | 0.0 /100 | #290 | Tragic 14.1% |
| Okinawans | 0.0 /100 | #291 | Tragic 14.1% |
| Pima | 0.0 /100 | #292 | Tragic 14.1% |
| Immigrants | Jamaica | 0.0 /100 | #293 | Tragic 14.2% |
| Belizeans | 0.0 /100 | #294 | Tragic 14.3% |
| Paraguayans | 0.0 /100 | #295 | Tragic 14.4% |
| Immigrants | Spain | 0.0 /100 | #296 | Tragic 14.5% |
| Immigrants | Panama | 0.0 /100 | #297 | Tragic 14.6% |
| Moroccans | 0.0 /100 | #298 | Tragic 14.7% |
Demographics Similar to Immigrants from Zimbabwe by No Vehicles in Household
In terms of no vehicles in household, the demographic groups most similar to Immigrants from Zimbabwe are Sudanese (9.8%, a difference of 0.13%), Immigrants from Lithuania (9.8%, a difference of 0.35%), Chilean (9.9%, a difference of 0.35%), Immigrants from Bahamas (9.9%, a difference of 0.35%), and Marshallese (9.8%, a difference of 0.36%).
| Demographics | Rating | Rank | No Vehicles in Household |
| Latvians | 85.1 /100 | #135 | Excellent 9.8% |
| Immigrants | South Africa | 85.0 /100 | #136 | Excellent 9.8% |
| Immigrants | Moldova | 84.6 /100 | #137 | Excellent 9.8% |
| Estonians | 84.2 /100 | #138 | Excellent 9.8% |
| Marshallese | 84.0 /100 | #139 | Excellent 9.8% |
| Immigrants | Lithuania | 84.0 /100 | #140 | Excellent 9.8% |
| Sudanese | 83.1 /100 | #141 | Excellent 9.8% |
| Immigrants | Zimbabwe | 82.6 /100 | #142 | Excellent 9.9% |
| Chileans | 81.2 /100 | #143 | Excellent 9.9% |
| Immigrants | Bahamas | 81.2 /100 | #144 | Excellent 9.9% |
| Bahamians | 81.0 /100 | #145 | Excellent 9.9% |
| Hungarians | 80.0 /100 | #146 | Excellent 9.9% |
| Immigrants | Nicaragua | 79.8 /100 | #147 | Good 9.9% |
| Immigrants | Bosnia and Herzegovina | 79.1 /100 | #148 | Good 9.9% |
| Immigrants | Uganda | 76.1 /100 | #149 | Good 10.0% |