Norwegian vs Pueblo Female Poverty
COMPARE
Norwegian
Pueblo
Female Poverty
Female Poverty Comparison
Norwegians
Pueblo
11.5%
FEMALE POVERTY
99.8/ 100
METRIC RATING
19th/ 347
METRIC RANK
20.7%
FEMALE POVERTY
0.0/ 100
METRIC RATING
336th/ 347
METRIC RANK
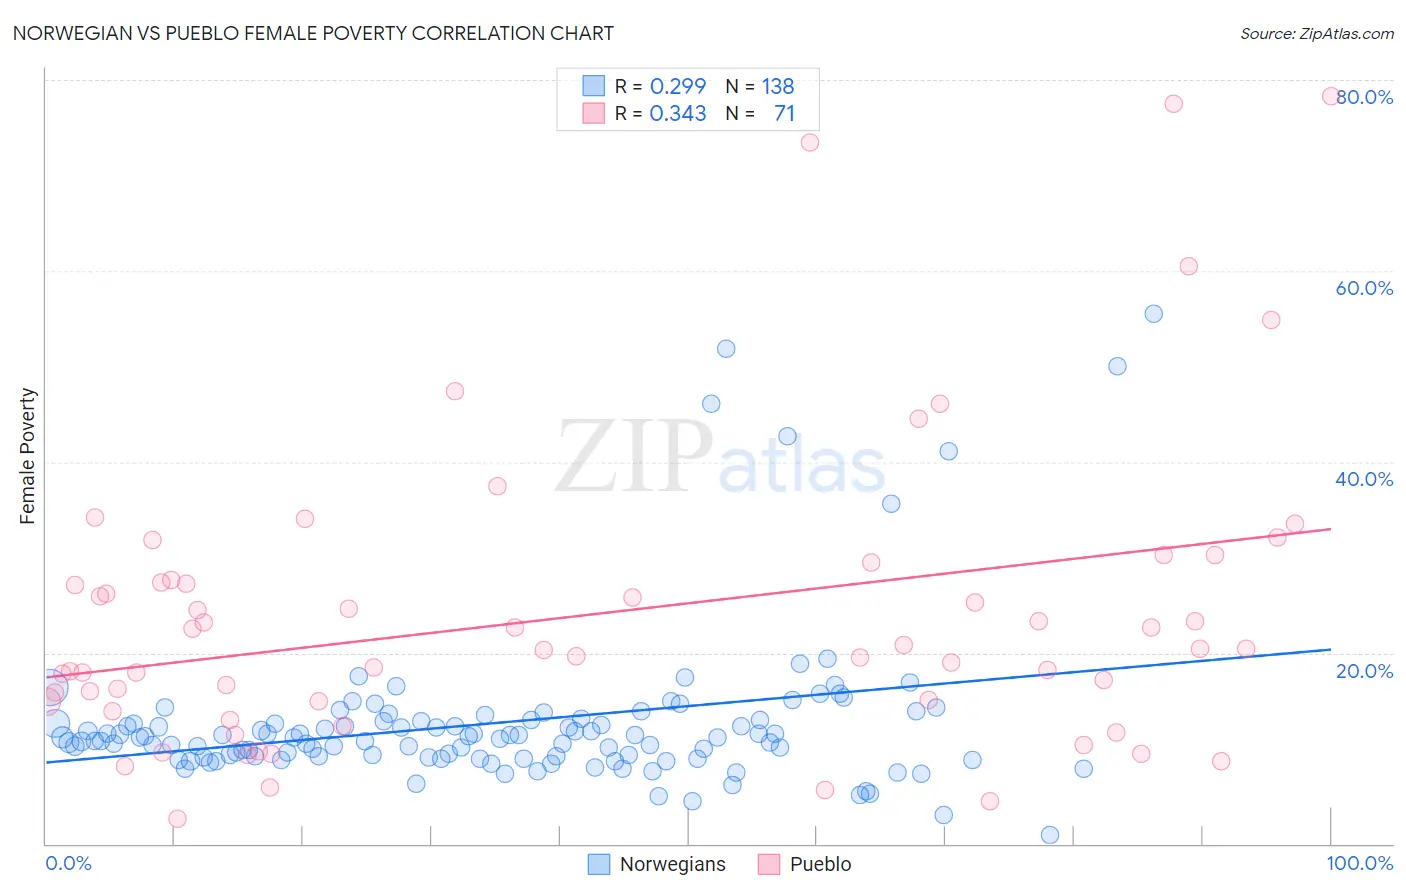
Norwegian vs Pueblo Female Poverty Correlation Chart
The statistical analysis conducted on geographies consisting of 532,481,223 people shows a weak positive correlation between the proportion of Norwegians and poverty level among females in the United States with a correlation coefficient (R) of 0.299 and weighted average of 11.5%. Similarly, the statistical analysis conducted on geographies consisting of 120,063,316 people shows a mild positive correlation between the proportion of Pueblo and poverty level among females in the United States with a correlation coefficient (R) of 0.343 and weighted average of 20.7%, a difference of 79.7%.
Female Poverty Correlation Summary
| Measurement | Norwegian | Pueblo |
| Minimum | 0.92% | 2.6% |
| Maximum | 55.6% | 78.3% |
| Range | 54.6% | 75.6% |
| Mean | 12.7% | 24.0% |
| Median | 11.1% | 20.4% |
| Interquartile 25% (IQ1) | 9.0% | 14.9% |
| Interquartile 75% (IQ3) | 12.9% | 27.6% |
| Interquartile Range (IQR) | 3.8% | 12.7% |
| Standard Deviation (Sample) | 8.4% | 15.8% |
| Standard Deviation (Population) | 8.4% | 15.7% |
Similar Demographics by Female Poverty
Demographics Similar to Norwegians by Female Poverty
In terms of female poverty, the demographic groups most similar to Norwegians are Immigrants from Scotland (11.5%, a difference of 0.040%), Bolivian (11.5%, a difference of 0.090%), Immigrants from Bolivia (11.5%, a difference of 0.16%), Eastern European (11.5%, a difference of 0.23%), and Latvian (11.4%, a difference of 0.64%).
| Demographics | Rating | Rank | Female Poverty |
| Bhutanese | 99.9 /100 | #12 | Exceptional 11.3% |
| Immigrants | Lithuania | 99.9 /100 | #13 | Exceptional 11.3% |
| Lithuanians | 99.8 /100 | #14 | Exceptional 11.4% |
| Latvians | 99.8 /100 | #15 | Exceptional 11.4% |
| Immigrants | Bolivia | 99.8 /100 | #16 | Exceptional 11.5% |
| Bolivians | 99.8 /100 | #17 | Exceptional 11.5% |
| Immigrants | Scotland | 99.8 /100 | #18 | Exceptional 11.5% |
| Norwegians | 99.8 /100 | #19 | Exceptional 11.5% |
| Eastern Europeans | 99.7 /100 | #20 | Exceptional 11.5% |
| Italians | 99.7 /100 | #21 | Exceptional 11.6% |
| Swedes | 99.7 /100 | #22 | Exceptional 11.6% |
| Burmese | 99.7 /100 | #23 | Exceptional 11.6% |
| Luxembourgers | 99.7 /100 | #24 | Exceptional 11.6% |
| Immigrants | Northern Europe | 99.6 /100 | #25 | Exceptional 11.6% |
| Croatians | 99.6 /100 | #26 | Exceptional 11.6% |
Demographics Similar to Pueblo by Female Poverty
In terms of female poverty, the demographic groups most similar to Pueblo are Yuman (20.8%, a difference of 0.81%), Sioux (20.9%, a difference of 1.0%), Hopi (21.0%, a difference of 1.4%), Cheyenne (20.2%, a difference of 2.4%), and Houma (20.0%, a difference of 3.2%).
| Demographics | Rating | Rank | Female Poverty |
| Kiowa | 0.0 /100 | #329 | Tragic 18.6% |
| Dominicans | 0.0 /100 | #330 | Tragic 19.1% |
| Natives/Alaskans | 0.0 /100 | #331 | Tragic 19.2% |
| Apache | 0.0 /100 | #332 | Tragic 19.2% |
| Immigrants | Dominican Republic | 0.0 /100 | #333 | Tragic 19.3% |
| Houma | 0.0 /100 | #334 | Tragic 20.0% |
| Cheyenne | 0.0 /100 | #335 | Tragic 20.2% |
| Pueblo | 0.0 /100 | #336 | Tragic 20.7% |
| Yuman | 0.0 /100 | #337 | Tragic 20.8% |
| Sioux | 0.0 /100 | #338 | Tragic 20.9% |
| Hopi | 0.0 /100 | #339 | Tragic 21.0% |
| Yup'ik | 0.0 /100 | #340 | Tragic 21.5% |
| Crow | 0.0 /100 | #341 | Tragic 22.1% |
| Immigrants | Yemen | 0.0 /100 | #342 | Tragic 22.8% |
| Lumbee | 0.0 /100 | #343 | Tragic 23.5% |