Norwegian vs Seminole Female Poverty
COMPARE
Norwegian
Seminole
Female Poverty
Female Poverty Comparison
Norwegians
Seminole
11.5%
FEMALE POVERTY
99.8/ 100
METRIC RATING
19th/ 347
METRIC RANK
16.9%
FEMALE POVERTY
0.0/ 100
METRIC RATING
307th/ 347
METRIC RANK
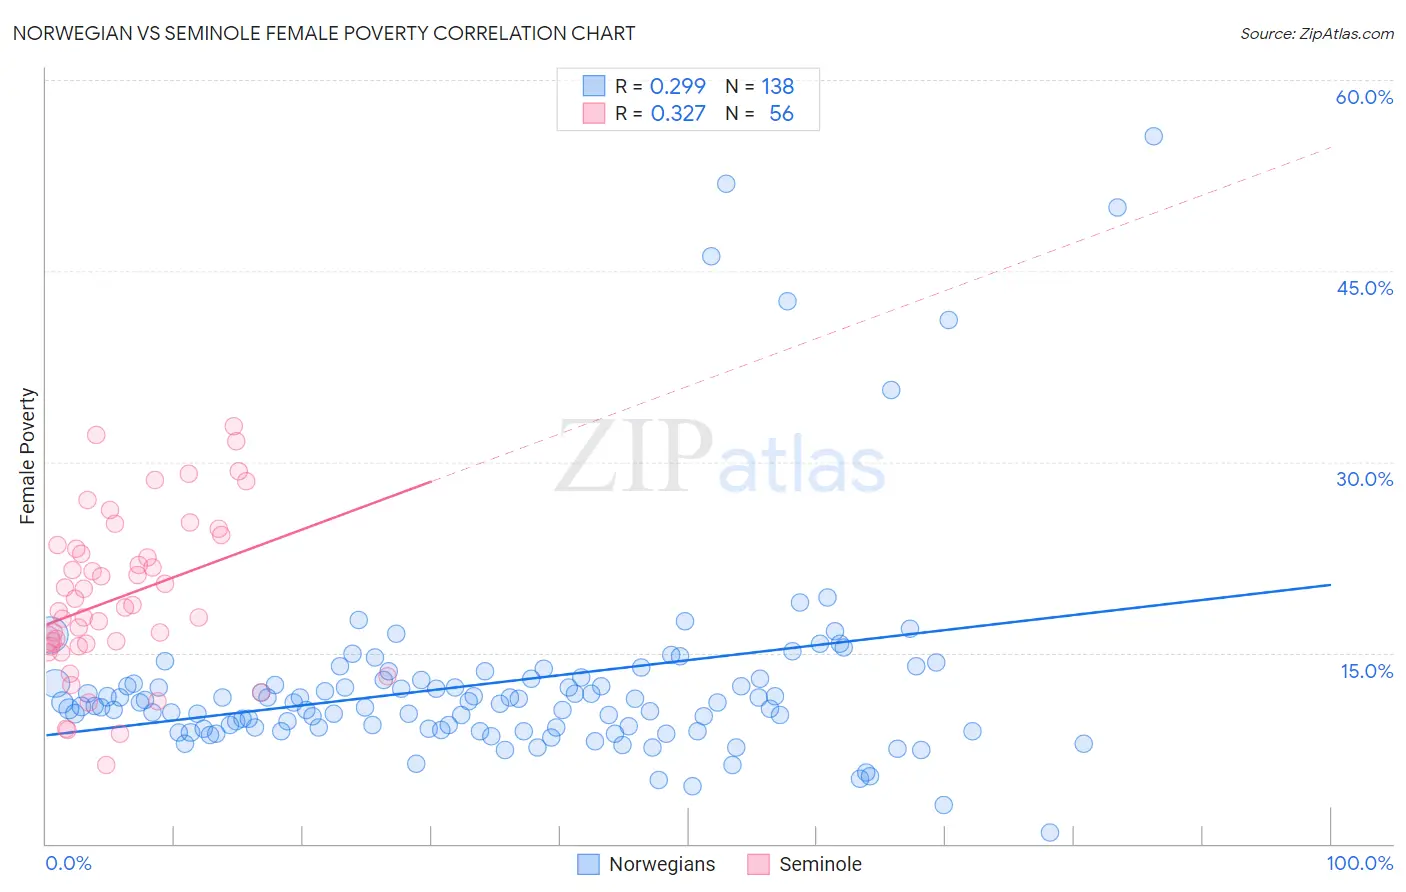
Norwegian vs Seminole Female Poverty Correlation Chart
The statistical analysis conducted on geographies consisting of 532,481,223 people shows a weak positive correlation between the proportion of Norwegians and poverty level among females in the United States with a correlation coefficient (R) of 0.299 and weighted average of 11.5%. Similarly, the statistical analysis conducted on geographies consisting of 118,292,292 people shows a mild positive correlation between the proportion of Seminole and poverty level among females in the United States with a correlation coefficient (R) of 0.327 and weighted average of 16.9%, a difference of 46.8%.
Female Poverty Correlation Summary
| Measurement | Norwegian | Seminole |
| Minimum | 0.92% | 6.2% |
| Maximum | 55.6% | 32.8% |
| Range | 54.6% | 26.6% |
| Mean | 12.7% | 19.4% |
| Median | 11.1% | 18.6% |
| Interquartile 25% (IQ1) | 9.0% | 15.6% |
| Interquartile 75% (IQ3) | 12.9% | 23.3% |
| Interquartile Range (IQR) | 3.8% | 7.7% |
| Standard Deviation (Sample) | 8.4% | 6.2% |
| Standard Deviation (Population) | 8.4% | 6.2% |
Similar Demographics by Female Poverty
Demographics Similar to Norwegians by Female Poverty
In terms of female poverty, the demographic groups most similar to Norwegians are Immigrants from Scotland (11.5%, a difference of 0.040%), Bolivian (11.5%, a difference of 0.090%), Immigrants from Bolivia (11.5%, a difference of 0.16%), Eastern European (11.5%, a difference of 0.23%), and Latvian (11.4%, a difference of 0.64%).
| Demographics | Rating | Rank | Female Poverty |
| Bhutanese | 99.9 /100 | #12 | Exceptional 11.3% |
| Immigrants | Lithuania | 99.9 /100 | #13 | Exceptional 11.3% |
| Lithuanians | 99.8 /100 | #14 | Exceptional 11.4% |
| Latvians | 99.8 /100 | #15 | Exceptional 11.4% |
| Immigrants | Bolivia | 99.8 /100 | #16 | Exceptional 11.5% |
| Bolivians | 99.8 /100 | #17 | Exceptional 11.5% |
| Immigrants | Scotland | 99.8 /100 | #18 | Exceptional 11.5% |
| Norwegians | 99.8 /100 | #19 | Exceptional 11.5% |
| Eastern Europeans | 99.7 /100 | #20 | Exceptional 11.5% |
| Italians | 99.7 /100 | #21 | Exceptional 11.6% |
| Swedes | 99.7 /100 | #22 | Exceptional 11.6% |
| Burmese | 99.7 /100 | #23 | Exceptional 11.6% |
| Luxembourgers | 99.7 /100 | #24 | Exceptional 11.6% |
| Immigrants | Northern Europe | 99.6 /100 | #25 | Exceptional 11.6% |
| Croatians | 99.6 /100 | #26 | Exceptional 11.6% |
Demographics Similar to Seminole by Female Poverty
In terms of female poverty, the demographic groups most similar to Seminole are African (16.9%, a difference of 0.060%), Immigrants from Caribbean (16.9%, a difference of 0.12%), Immigrants from Grenada (16.8%, a difference of 0.39%), Immigrants from Central America (16.8%, a difference of 0.40%), and Immigrants from Mexico (17.0%, a difference of 0.45%).
| Demographics | Rating | Rank | Female Poverty |
| Bahamians | 0.0 /100 | #300 | Tragic 16.6% |
| Guatemalans | 0.0 /100 | #301 | Tragic 16.7% |
| Chippewa | 0.0 /100 | #302 | Tragic 16.7% |
| Choctaw | 0.0 /100 | #303 | Tragic 16.8% |
| Immigrants | Central America | 0.0 /100 | #304 | Tragic 16.8% |
| Immigrants | Grenada | 0.0 /100 | #305 | Tragic 16.8% |
| Immigrants | Caribbean | 0.0 /100 | #306 | Tragic 16.9% |
| Seminole | 0.0 /100 | #307 | Tragic 16.9% |
| Africans | 0.0 /100 | #308 | Tragic 16.9% |
| Immigrants | Mexico | 0.0 /100 | #309 | Tragic 17.0% |
| Creek | 0.0 /100 | #310 | Tragic 17.0% |
| Immigrants | Guatemala | 0.0 /100 | #311 | Tragic 17.0% |
| Immigrants | Somalia | 0.0 /100 | #312 | Tragic 17.0% |
| British West Indians | 0.0 /100 | #313 | Tragic 17.0% |
| Dutch West Indians | 0.0 /100 | #314 | Tragic 17.1% |