Immigrants from Malaysia vs Pueblo Female Poverty
COMPARE
Immigrants from Malaysia
Pueblo
Female Poverty
Female Poverty Comparison
Immigrants from Malaysia
Pueblo
13.0%
FEMALE POVERTY
80.4/ 100
METRIC RATING
143rd/ 347
METRIC RANK
20.7%
FEMALE POVERTY
0.0/ 100
METRIC RATING
336th/ 347
METRIC RANK
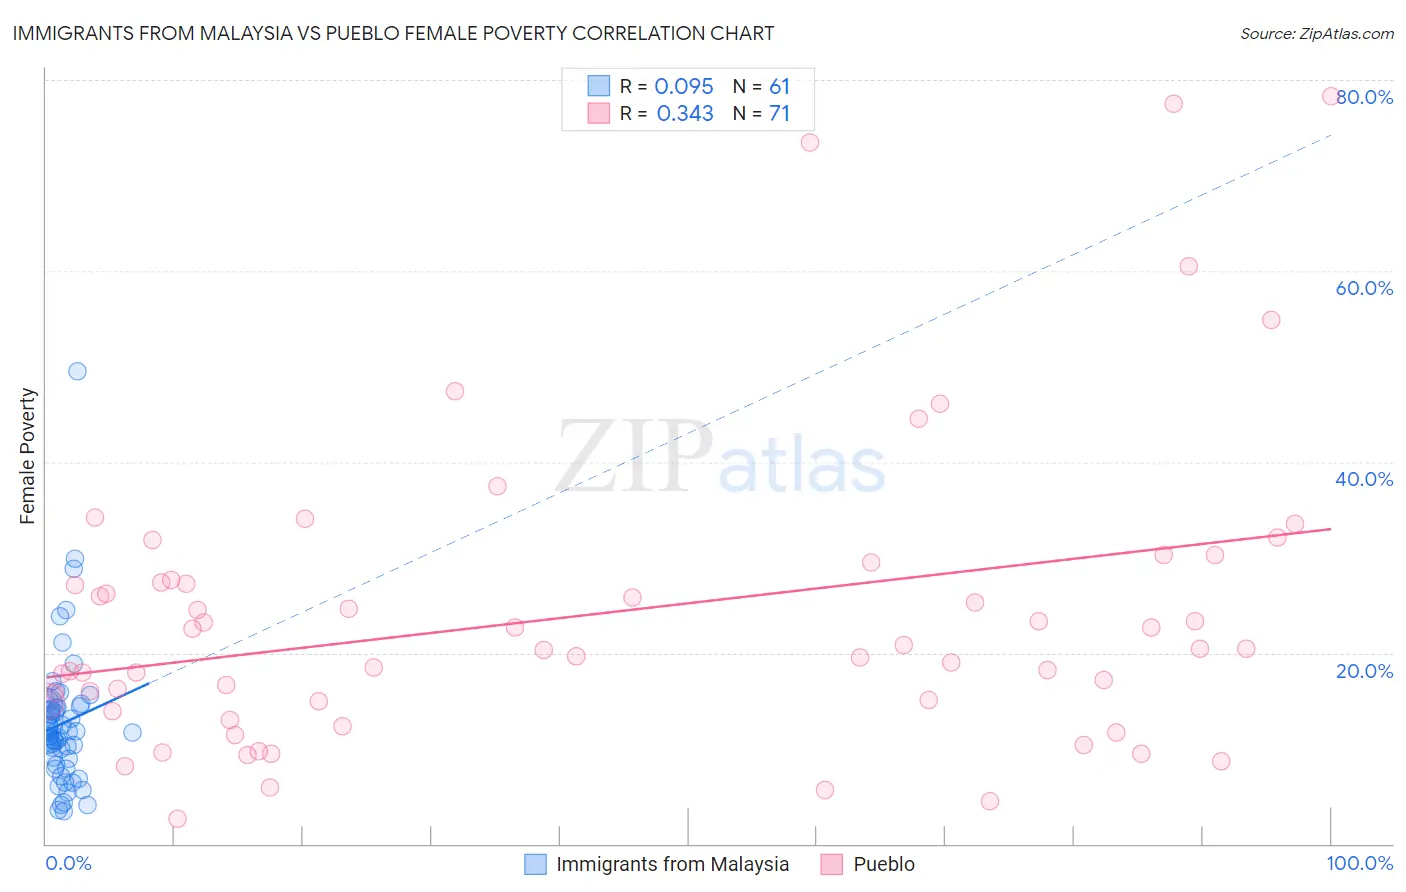
Immigrants from Malaysia vs Pueblo Female Poverty Correlation Chart
The statistical analysis conducted on geographies consisting of 197,903,089 people shows a slight positive correlation between the proportion of Immigrants from Malaysia and poverty level among females in the United States with a correlation coefficient (R) of 0.095 and weighted average of 13.0%. Similarly, the statistical analysis conducted on geographies consisting of 120,063,316 people shows a mild positive correlation between the proportion of Pueblo and poverty level among females in the United States with a correlation coefficient (R) of 0.343 and weighted average of 20.7%, a difference of 59.2%.
Female Poverty Correlation Summary
| Measurement | Immigrants from Malaysia | Pueblo |
| Minimum | 3.4% | 2.6% |
| Maximum | 49.6% | 78.3% |
| Range | 46.2% | 75.6% |
| Mean | 12.6% | 24.0% |
| Median | 11.6% | 20.4% |
| Interquartile 25% (IQ1) | 8.6% | 14.9% |
| Interquartile 75% (IQ3) | 14.3% | 27.6% |
| Interquartile Range (IQR) | 5.7% | 12.7% |
| Standard Deviation (Sample) | 7.3% | 15.8% |
| Standard Deviation (Population) | 7.2% | 15.7% |
Similar Demographics by Female Poverty
Demographics Similar to Immigrants from Malaysia by Female Poverty
In terms of female poverty, the demographic groups most similar to Immigrants from Malaysia are Brazilian (13.0%, a difference of 0.020%), Afghan (13.0%, a difference of 0.090%), Icelander (13.0%, a difference of 0.12%), Syrian (13.0%, a difference of 0.12%), and Immigrants from Peru (13.0%, a difference of 0.19%).
| Demographics | Rating | Rank | Female Poverty |
| Peruvians | 85.2 /100 | #136 | Excellent 12.9% |
| Chileans | 84.7 /100 | #137 | Excellent 12.9% |
| Immigrants | France | 83.6 /100 | #138 | Excellent 12.9% |
| Basques | 83.1 /100 | #139 | Excellent 12.9% |
| Pakistanis | 83.0 /100 | #140 | Excellent 12.9% |
| Icelanders | 81.1 /100 | #141 | Excellent 13.0% |
| Brazilians | 80.5 /100 | #142 | Excellent 13.0% |
| Immigrants | Malaysia | 80.4 /100 | #143 | Excellent 13.0% |
| Afghans | 79.8 /100 | #144 | Good 13.0% |
| Syrians | 79.6 /100 | #145 | Good 13.0% |
| Immigrants | Peru | 79.1 /100 | #146 | Good 13.0% |
| Immigrants | Kazakhstan | 78.6 /100 | #147 | Good 13.0% |
| Yugoslavians | 76.9 /100 | #148 | Good 13.1% |
| Taiwanese | 75.7 /100 | #149 | Good 13.1% |
| Tsimshian | 75.5 /100 | #150 | Good 13.1% |
Demographics Similar to Pueblo by Female Poverty
In terms of female poverty, the demographic groups most similar to Pueblo are Yuman (20.8%, a difference of 0.81%), Sioux (20.9%, a difference of 1.0%), Hopi (21.0%, a difference of 1.4%), Cheyenne (20.2%, a difference of 2.4%), and Houma (20.0%, a difference of 3.2%).
| Demographics | Rating | Rank | Female Poverty |
| Kiowa | 0.0 /100 | #329 | Tragic 18.6% |
| Dominicans | 0.0 /100 | #330 | Tragic 19.1% |
| Natives/Alaskans | 0.0 /100 | #331 | Tragic 19.2% |
| Apache | 0.0 /100 | #332 | Tragic 19.2% |
| Immigrants | Dominican Republic | 0.0 /100 | #333 | Tragic 19.3% |
| Houma | 0.0 /100 | #334 | Tragic 20.0% |
| Cheyenne | 0.0 /100 | #335 | Tragic 20.2% |
| Pueblo | 0.0 /100 | #336 | Tragic 20.7% |
| Yuman | 0.0 /100 | #337 | Tragic 20.8% |
| Sioux | 0.0 /100 | #338 | Tragic 20.9% |
| Hopi | 0.0 /100 | #339 | Tragic 21.0% |
| Yup'ik | 0.0 /100 | #340 | Tragic 21.5% |
| Crow | 0.0 /100 | #341 | Tragic 22.1% |
| Immigrants | Yemen | 0.0 /100 | #342 | Tragic 22.8% |
| Lumbee | 0.0 /100 | #343 | Tragic 23.5% |