Immigrants from Venezuela vs Pueblo Female Poverty
COMPARE
Immigrants from Venezuela
Pueblo
Female Poverty
Female Poverty Comparison
Immigrants from Venezuela
Pueblo
13.6%
FEMALE POVERTY
41.0/ 100
METRIC RATING
187th/ 347
METRIC RANK
20.7%
FEMALE POVERTY
0.0/ 100
METRIC RATING
336th/ 347
METRIC RANK
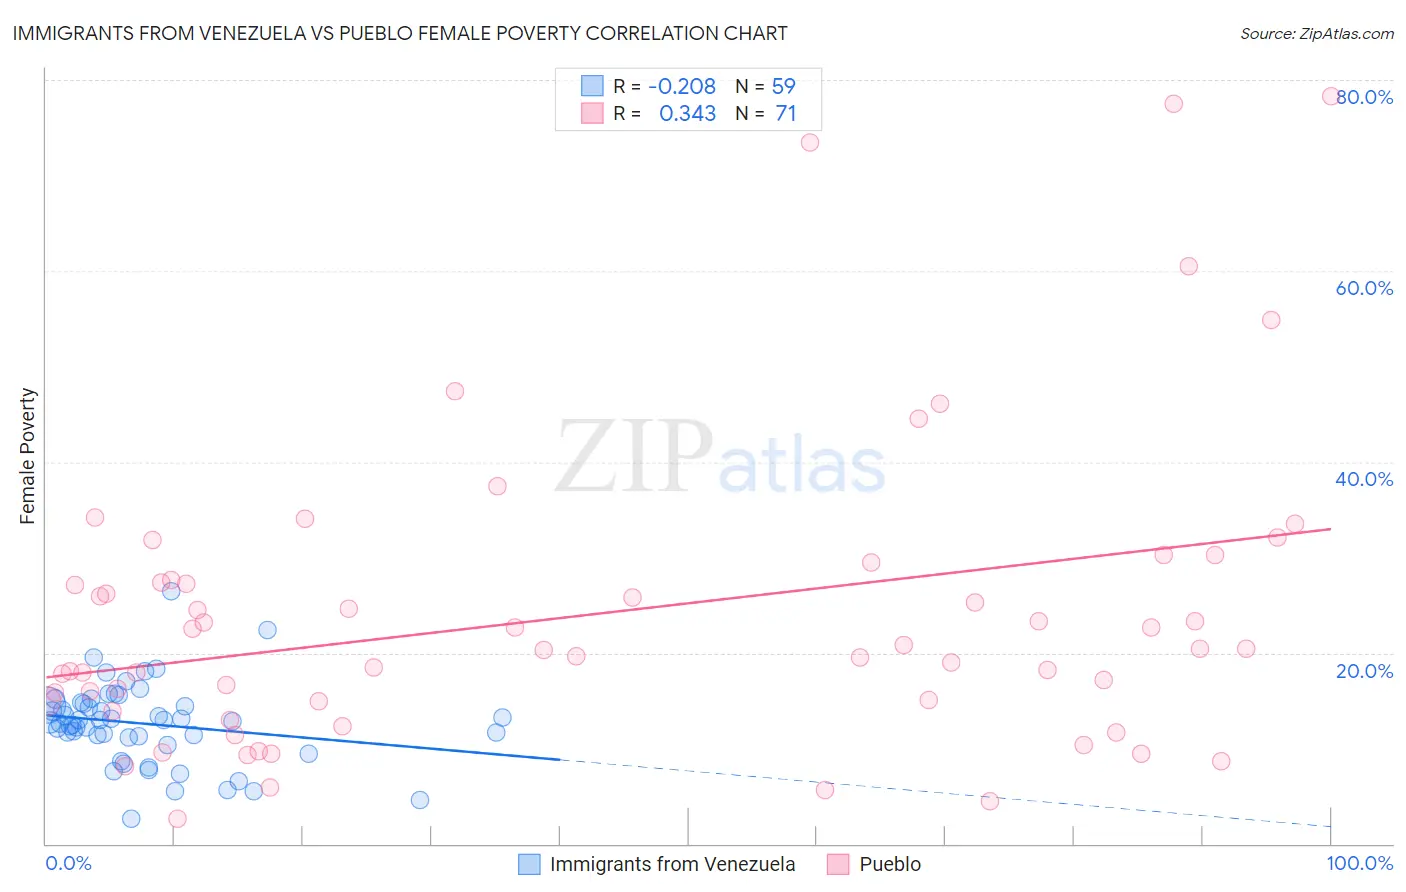
Immigrants from Venezuela vs Pueblo Female Poverty Correlation Chart
The statistical analysis conducted on geographies consisting of 287,717,051 people shows a weak negative correlation between the proportion of Immigrants from Venezuela and poverty level among females in the United States with a correlation coefficient (R) of -0.208 and weighted average of 13.6%. Similarly, the statistical analysis conducted on geographies consisting of 120,063,316 people shows a mild positive correlation between the proportion of Pueblo and poverty level among females in the United States with a correlation coefficient (R) of 0.343 and weighted average of 20.7%, a difference of 52.5%.
Female Poverty Correlation Summary
| Measurement | Immigrants from Venezuela | Pueblo |
| Minimum | 2.7% | 2.6% |
| Maximum | 26.5% | 78.3% |
| Range | 23.8% | 75.6% |
| Mean | 12.6% | 24.0% |
| Median | 12.8% | 20.4% |
| Interquartile 25% (IQ1) | 11.2% | 14.9% |
| Interquartile 75% (IQ3) | 14.6% | 27.6% |
| Interquartile Range (IQR) | 3.5% | 12.7% |
| Standard Deviation (Sample) | 4.2% | 15.8% |
| Standard Deviation (Population) | 4.2% | 15.7% |
Similar Demographics by Female Poverty
Demographics Similar to Immigrants from Venezuela by Female Poverty
In terms of female poverty, the demographic groups most similar to Immigrants from Venezuela are Immigrants from Portugal (13.6%, a difference of 0.050%), Immigrants from Cameroon (13.5%, a difference of 0.11%), Hawaiian (13.6%, a difference of 0.11%), Uruguayan (13.6%, a difference of 0.11%), and Immigrants from Sierra Leone (13.5%, a difference of 0.22%).
| Demographics | Rating | Rank | Female Poverty |
| South Americans | 44.8 /100 | #180 | Average 13.5% |
| Venezuelans | 44.5 /100 | #181 | Average 13.5% |
| Immigrants | Colombia | 44.5 /100 | #182 | Average 13.5% |
| Kenyans | 43.8 /100 | #183 | Average 13.5% |
| Immigrants | Sierra Leone | 43.2 /100 | #184 | Average 13.5% |
| Immigrants | Cameroon | 42.0 /100 | #185 | Average 13.5% |
| Immigrants | Portugal | 41.5 /100 | #186 | Average 13.6% |
| Immigrants | Venezuela | 41.0 /100 | #187 | Average 13.6% |
| Hawaiians | 39.9 /100 | #188 | Fair 13.6% |
| Uruguayans | 39.8 /100 | #189 | Fair 13.6% |
| Sierra Leoneans | 33.1 /100 | #190 | Fair 13.7% |
| Immigrants | Kuwait | 32.7 /100 | #191 | Fair 13.7% |
| Immigrants | Costa Rica | 31.9 /100 | #192 | Fair 13.7% |
| Iraqis | 31.8 /100 | #193 | Fair 13.7% |
| Delaware | 31.1 /100 | #194 | Fair 13.7% |
Demographics Similar to Pueblo by Female Poverty
In terms of female poverty, the demographic groups most similar to Pueblo are Yuman (20.8%, a difference of 0.81%), Sioux (20.9%, a difference of 1.0%), Hopi (21.0%, a difference of 1.4%), Cheyenne (20.2%, a difference of 2.4%), and Houma (20.0%, a difference of 3.2%).
| Demographics | Rating | Rank | Female Poverty |
| Kiowa | 0.0 /100 | #329 | Tragic 18.6% |
| Dominicans | 0.0 /100 | #330 | Tragic 19.1% |
| Natives/Alaskans | 0.0 /100 | #331 | Tragic 19.2% |
| Apache | 0.0 /100 | #332 | Tragic 19.2% |
| Immigrants | Dominican Republic | 0.0 /100 | #333 | Tragic 19.3% |
| Houma | 0.0 /100 | #334 | Tragic 20.0% |
| Cheyenne | 0.0 /100 | #335 | Tragic 20.2% |
| Pueblo | 0.0 /100 | #336 | Tragic 20.7% |
| Yuman | 0.0 /100 | #337 | Tragic 20.8% |
| Sioux | 0.0 /100 | #338 | Tragic 20.9% |
| Hopi | 0.0 /100 | #339 | Tragic 21.0% |
| Yup'ik | 0.0 /100 | #340 | Tragic 21.5% |
| Crow | 0.0 /100 | #341 | Tragic 22.1% |
| Immigrants | Yemen | 0.0 /100 | #342 | Tragic 22.8% |
| Lumbee | 0.0 /100 | #343 | Tragic 23.5% |