Norwegian vs South American Female Poverty
COMPARE
Norwegian
South American
Female Poverty
Female Poverty Comparison
Norwegians
South Americans
11.5%
FEMALE POVERTY
99.8/ 100
METRIC RATING
19th/ 347
METRIC RANK
13.5%
FEMALE POVERTY
44.8/ 100
METRIC RATING
180th/ 347
METRIC RANK
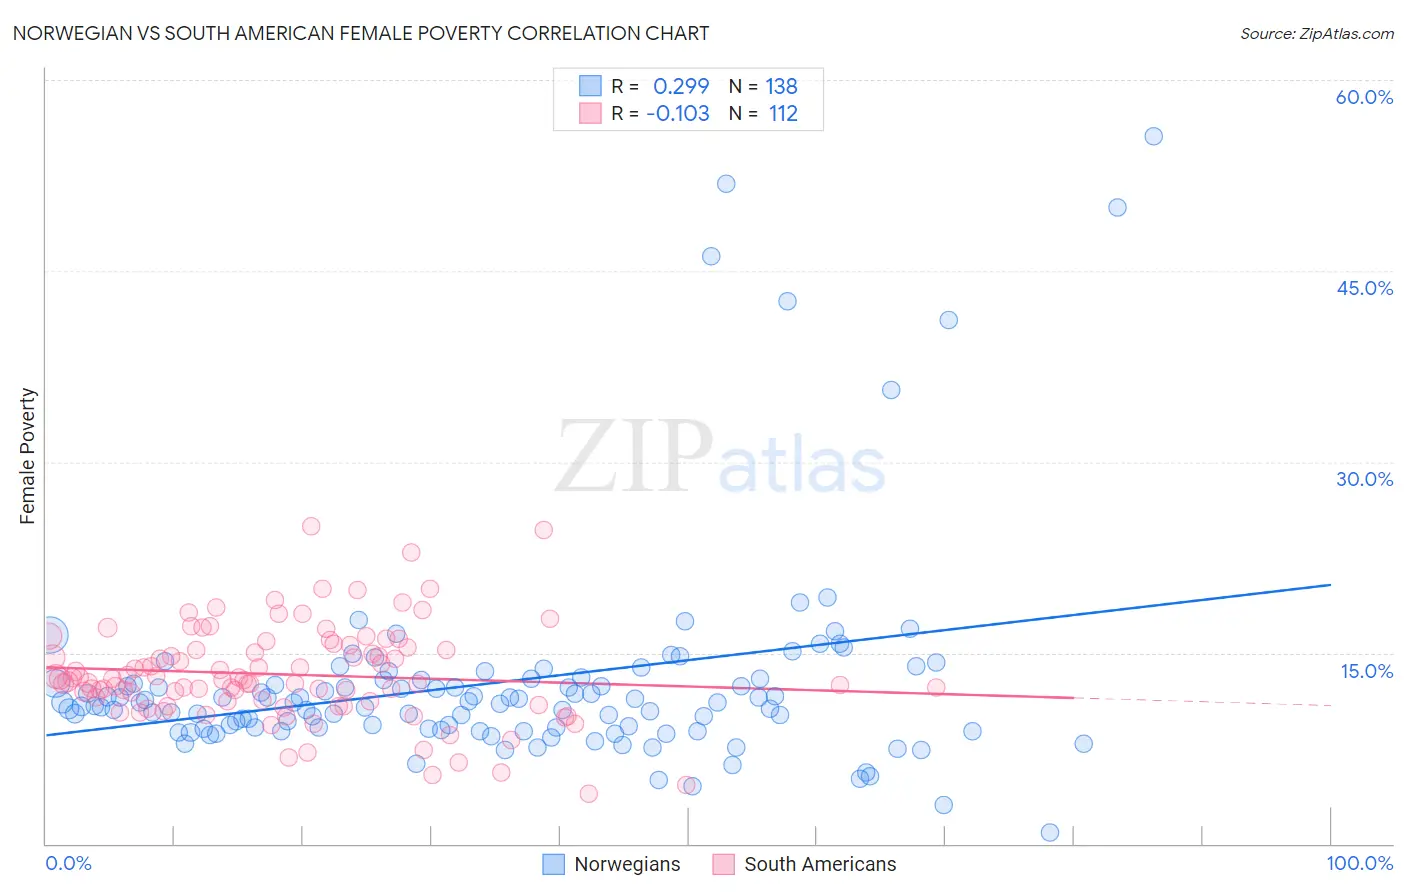
Norwegian vs South American Female Poverty Correlation Chart
The statistical analysis conducted on geographies consisting of 532,481,223 people shows a weak positive correlation between the proportion of Norwegians and poverty level among females in the United States with a correlation coefficient (R) of 0.299 and weighted average of 11.5%. Similarly, the statistical analysis conducted on geographies consisting of 493,491,329 people shows a poor negative correlation between the proportion of South Americans and poverty level among females in the United States with a correlation coefficient (R) of -0.103 and weighted average of 13.5%, a difference of 17.4%.
Female Poverty Correlation Summary
| Measurement | Norwegian | South American |
| Minimum | 0.92% | 4.0% |
| Maximum | 55.6% | 25.0% |
| Range | 54.6% | 21.0% |
| Mean | 12.7% | 13.3% |
| Median | 11.1% | 12.9% |
| Interquartile 25% (IQ1) | 9.0% | 11.2% |
| Interquartile 75% (IQ3) | 12.9% | 15.3% |
| Interquartile Range (IQR) | 3.8% | 4.2% |
| Standard Deviation (Sample) | 8.4% | 3.7% |
| Standard Deviation (Population) | 8.4% | 3.7% |
Similar Demographics by Female Poverty
Demographics Similar to Norwegians by Female Poverty
In terms of female poverty, the demographic groups most similar to Norwegians are Immigrants from Scotland (11.5%, a difference of 0.040%), Bolivian (11.5%, a difference of 0.090%), Immigrants from Bolivia (11.5%, a difference of 0.16%), Eastern European (11.5%, a difference of 0.23%), and Latvian (11.4%, a difference of 0.64%).
| Demographics | Rating | Rank | Female Poverty |
| Bhutanese | 99.9 /100 | #12 | Exceptional 11.3% |
| Immigrants | Lithuania | 99.9 /100 | #13 | Exceptional 11.3% |
| Lithuanians | 99.8 /100 | #14 | Exceptional 11.4% |
| Latvians | 99.8 /100 | #15 | Exceptional 11.4% |
| Immigrants | Bolivia | 99.8 /100 | #16 | Exceptional 11.5% |
| Bolivians | 99.8 /100 | #17 | Exceptional 11.5% |
| Immigrants | Scotland | 99.8 /100 | #18 | Exceptional 11.5% |
| Norwegians | 99.8 /100 | #19 | Exceptional 11.5% |
| Eastern Europeans | 99.7 /100 | #20 | Exceptional 11.5% |
| Italians | 99.7 /100 | #21 | Exceptional 11.6% |
| Swedes | 99.7 /100 | #22 | Exceptional 11.6% |
| Burmese | 99.7 /100 | #23 | Exceptional 11.6% |
| Luxembourgers | 99.7 /100 | #24 | Exceptional 11.6% |
| Immigrants | Northern Europe | 99.6 /100 | #25 | Exceptional 11.6% |
| Croatians | 99.6 /100 | #26 | Exceptional 11.6% |
Demographics Similar to South Americans by Female Poverty
In terms of female poverty, the demographic groups most similar to South Americans are Venezuelan (13.5%, a difference of 0.030%), Immigrants from Colombia (13.5%, a difference of 0.030%), Kenyan (13.5%, a difference of 0.10%), Immigrants from Sierra Leone (13.5%, a difference of 0.16%), and Immigrants from Cameroon (13.5%, a difference of 0.27%).
| Demographics | Rating | Rank | Female Poverty |
| Immigrants | Afghanistan | 50.8 /100 | #173 | Average 13.4% |
| Immigrants | Iraq | 50.0 /100 | #174 | Average 13.4% |
| Celtics | 49.9 /100 | #175 | Average 13.4% |
| Immigrants | Spain | 49.9 /100 | #176 | Average 13.4% |
| Immigrants | Morocco | 49.4 /100 | #177 | Average 13.4% |
| Israelis | 49.1 /100 | #178 | Average 13.5% |
| Immigrants | Syria | 48.8 /100 | #179 | Average 13.5% |
| South Americans | 44.8 /100 | #180 | Average 13.5% |
| Venezuelans | 44.5 /100 | #181 | Average 13.5% |
| Immigrants | Colombia | 44.5 /100 | #182 | Average 13.5% |
| Kenyans | 43.8 /100 | #183 | Average 13.5% |
| Immigrants | Sierra Leone | 43.2 /100 | #184 | Average 13.5% |
| Immigrants | Cameroon | 42.0 /100 | #185 | Average 13.5% |
| Immigrants | Portugal | 41.5 /100 | #186 | Average 13.6% |
| Immigrants | Venezuela | 41.0 /100 | #187 | Average 13.6% |