Nicaraguan vs Immigrants from Zimbabwe Married-Couple Family Poverty

COMPARE

Nicaraguan
Race
Ancestry
AfghanAfricanAlaska NativeAlaskan AthabascanAlbanianAleutAlsatianAmericanApacheArabArapahoArgentineanArmenianAssyrian/Chaldean/SyriacAustralianAustrianBahamianBangladeshiBarbadianBasqueBelgianBelizeanBermudanBhutaneseBlackfeetBolivianBrazilianBritishBritish West IndianBulgarianBurmeseCajunCambodianCanadianCape VerdeanCarpatho RusynCelticCentral AmericanCentral American IndianCherokeeCheyenneChickasawChileanChineseChippewaChoctawColombianColvilleComancheCosta RicanCreeCreekCroatianCrowCubanCypriotCzechCzechoslovakianDanishDelawareDominicanDutchDutch West IndianEastern EuropeanEcuadorianEgyptianEnglishEstonianEthiopianEuropeanFijianFilipinoFinnishFrenchFrench American IndianFrench CanadianGermanGerman RussianGhanaianGreekGuamanian/ChamorroGuatemalanGuyaneseHaitianHmongHonduranHopiHoumaHungarianIcelanderIndian (Asian)IndonesianInupiatIranianIraqiIrishIroquoisIsraeliItalianJamaicanJapaneseJordanianKenyanKiowaKoreanLaotianLatvianLebaneseLiberianLithuanianLumbeeLuxembourgerMacedonianMalaysianMalteseMarshalleseMenomineeMexicanMexican American IndianMongolianMoroccanNative HawaiianNavajoNepaleseNew ZealanderNicaraguanNigerianNorthern EuropeanNorwegianOkinawanOsageOttawaPaiutePakistaniPalestinianPanamanianParaguayanPennsylvania GermanPeruvianPimaPolishPortuguesePotawatomiPuebloPuerto RicanPuget Sound SalishRomanianRussianSalvadoranSamoanScandinavianScotch-IrishScottishSeminoleSenegaleseSerbianShoshoneSierra LeoneanSiouxSlavicSlovakSloveneSomaliSouth AfricanSouth AmericanSouth American IndianSoviet UnionSpaniardSpanishSpanish AmericanSpanish American IndianSri LankanSubsaharan AfricanSudaneseSwedishSwissSyrianTaiwaneseThaiTlingit-HaidaTohono O'OdhamTonganTrinidadian and TobagonianTsimshianTurkishU.S. Virgin IslanderUgandanUkrainianUruguayanUteVenezuelanVietnameseWelshWest IndianYakamaYaquiYugoslavianYumanYup'ikZimbabwean
Immigration
NonimmigrantsImmigrantsAfghanistanAfricaAlbaniaArgentinaArmeniaAsiaAustraliaAustriaBahamasBangladeshBarbadosBelarusBelgiumBelizeBoliviaBosnia and HerzegovinaBrazilBulgariaBurma/MyanmarCabo VerdeCambodiaCameroonCanadaCaribbeanCentral AmericaChileChinaColombiaCongoCosta RicaCroatiaCubaCzechoslovakiaDenmarkDominicaDominican RepublicEastern AfricaEastern AsiaEastern EuropeEcuadorEgyptEl SalvadorEnglandEritreaEthiopiaEuropeFijiFranceGermanyGhanaGreeceGrenadaGuatemalaGuyanaHaitiHondurasHong KongHungaryIndiaIndonesiaIranIraqIrelandIsraelItalyJamaicaJapanJordanKazakhstanKenyaKoreaKuwaitLaosLatin AmericaLatviaLebanonLiberiaLithuaniaMalaysiaMexicoMicronesiaMiddle AfricaMoldovaMoroccoNepalNetherlandsNicaraguaNigeriaNorth AmericaNorth MacedoniaNorthern AfricaNorthern EuropeNorwayOceaniaPakistanPanamaPeruPhilippinesPolandPortugalRomaniaRussiaSaudi ArabiaScotlandSenegalSerbiaSierra LeoneSingaporeSomaliaSouth AfricaSouth AmericaSouth Central AsiaSouth Eastern AsiaSouthern EuropeSpainSri LankaSt. Vincent and the GrenadinesSudanSwedenSwitzerlandSyriaTaiwanThailandTrinidad and TobagoTurkeyUgandaUkraineUruguayUzbekistanVenezuelaVietnamWest IndiesWestern AfricaWestern AsiaWestern EuropeYemenZaireAzores
Immigrants from Zimbabwe
Race
Ancestry
AfghanAfricanAlaska NativeAlaskan AthabascanAlbanianAleutAlsatianAmericanApacheArabArapahoArgentineanArmenianAssyrian/Chaldean/SyriacAustralianAustrianBahamianBangladeshiBarbadianBasqueBelgianBelizeanBermudanBhutaneseBlackfeetBolivianBrazilianBritishBritish West IndianBulgarianBurmeseCajunCambodianCanadianCape VerdeanCarpatho RusynCelticCentral AmericanCentral American IndianCherokeeCheyenneChickasawChileanChineseChippewaChoctawColombianColvilleComancheCosta RicanCreeCreekCroatianCrowCubanCypriotCzechCzechoslovakianDanishDelawareDominicanDutchDutch West IndianEastern EuropeanEcuadorianEgyptianEnglishEstonianEthiopianEuropeanFijianFilipinoFinnishFrenchFrench American IndianFrench CanadianGermanGerman RussianGhanaianGreekGuamanian/ChamorroGuatemalanGuyaneseHaitianHmongHonduranHopiHoumaHungarianIcelanderIndian (Asian)IndonesianInupiatIranianIraqiIrishIroquoisIsraeliItalianJamaicanJapaneseJordanianKenyanKiowaKoreanLaotianLatvianLebaneseLiberianLithuanianLumbeeLuxembourgerMacedonianMalaysianMalteseMarshalleseMenomineeMexicanMexican American IndianMongolianMoroccanNative HawaiianNavajoNepaleseNew ZealanderNigerianNorthern EuropeanNorwegianOkinawanOsageOttawaPaiutePakistaniPalestinianPanamanianParaguayanPennsylvania GermanPeruvianPimaPolishPortuguesePotawatomiPuebloPuerto RicanPuget Sound SalishRomanianRussianSalvadoranSamoanScandinavianScotch-IrishScottishSeminoleSenegaleseSerbianShoshoneSierra LeoneanSiouxSlavicSlovakSloveneSomaliSouth AfricanSouth AmericanSouth American IndianSoviet UnionSpaniardSpanishSpanish AmericanSpanish American IndianSri LankanSubsaharan AfricanSudaneseSwedishSwissSyrianTaiwaneseThaiTlingit-HaidaTohono O'OdhamTonganTrinidadian and TobagonianTsimshianTurkishU.S. Virgin IslanderUgandanUkrainianUruguayanUteVenezuelanVietnameseWelshWest IndianYakamaYaquiYugoslavianYumanYup'ikZimbabwean
Immigration
NonimmigrantsImmigrantsAfghanistanAfricaAlbaniaArgentinaArmeniaAsiaAustraliaAustriaBahamasBangladeshBarbadosBelarusBelgiumBelizeBoliviaBosnia and HerzegovinaBrazilBulgariaBurma/MyanmarCabo VerdeCambodiaCameroonCanadaCaribbeanCentral AmericaChileChinaColombiaCongoCosta RicaCroatiaCubaCzechoslovakiaDenmarkDominicaDominican RepublicEastern AfricaEastern AsiaEastern EuropeEcuadorEgyptEl SalvadorEnglandEritreaEthiopiaEuropeFijiFranceGermanyGhanaGreeceGrenadaGuatemalaGuyanaHaitiHondurasHong KongHungaryIndiaIndonesiaIranIraqIrelandIsraelItalyJamaicaJapanJordanKazakhstanKenyaKoreaKuwaitLaosLatin AmericaLatviaLebanonLiberiaLithuaniaMalaysiaMexicoMicronesiaMiddle AfricaMoldovaMoroccoNepalNetherlandsNicaraguaNigeriaNorth AmericaNorth MacedoniaNorthern AfricaNorthern EuropeNorwayOceaniaPakistanPanamaPeruPhilippinesPolandPortugalRomaniaRussiaSaudi ArabiaScotlandSenegalSerbiaSierra LeoneSingaporeSomaliaSouth AfricaSouth AmericaSouth Central AsiaSouth Eastern AsiaSouthern EuropeSpainSri LankaSt. Vincent and the GrenadinesSudanSwedenSwitzerlandSyriaTaiwanThailandTrinidad and TobagoTurkeyUgandaUkraineUruguayUzbekistanVenezuelaVietnamWest IndiesWestern AfricaWestern AsiaWestern EuropeYemenZaireZimbabweAzores
Married-Couple Family Poverty
Income
Poverty
Unemployment
Labor Participation
Family Structure
Vehicle Availability
Education Level
Disability

Married-Couple Family Poverty Comparison

Nicaraguans

Immigrants from Zimbabwe

Tragic
Exceptional
6.7%
MARRIED-COUPLE FAMILY POVERTY
0.0/ 100
METRIC RATING
299th/ 347
METRIC RANK
4.3%
MARRIED-COUPLE FAMILY POVERTY
99.7/ 100
METRIC RATING
56th/ 347
METRIC RANK

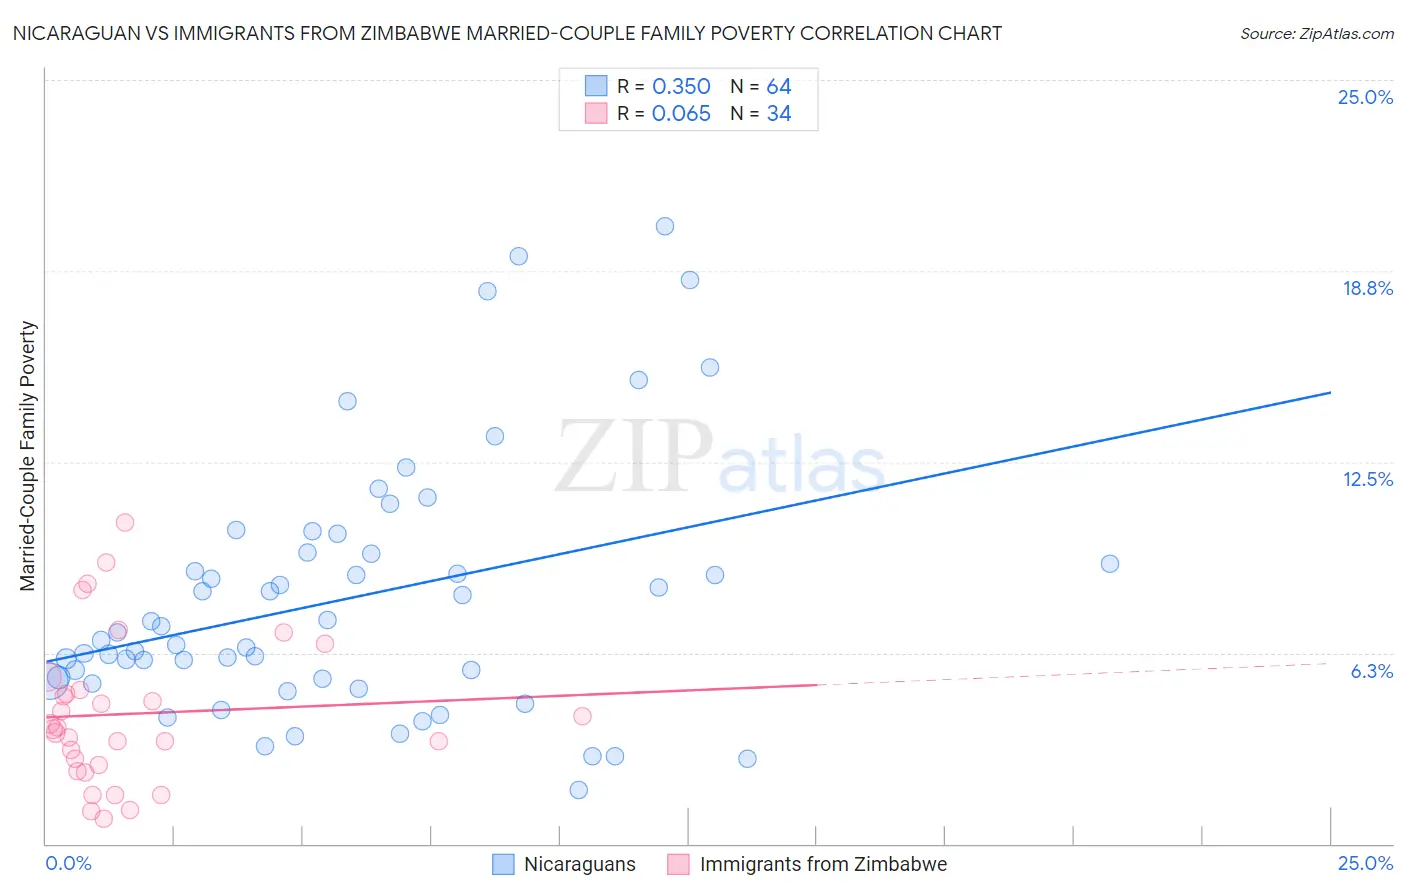
Nicaraguan vs Immigrants from Zimbabwe Married-Couple Family Poverty Correlation Chart

The statistical analysis conducted on geographies consisting of 284,450,167 people shows a mild positive correlation between the proportion of Nicaraguans and poverty level among married-couple families in the United States with a correlation coefficient (R) of 0.350 and weighted average of 6.7%. Similarly, the statistical analysis conducted on geographies consisting of 117,574,773 people shows a slight positive correlation between the proportion of Immigrants from Zimbabwe and poverty level among married-couple families in the United States with a correlation coefficient (R) of 0.065 and weighted average of 4.3%, a difference of 53.9%.
Nicaraguan vs Immigrants from Zimbabwe Married-Couple Family Poverty

Married-Couple Family Poverty Correlation Summary

MeasurementNicaraguanImmigrants from Zimbabwe
Minimum1.7%0.84%
Maximum20.2%10.5%
Range18.5%9.7%
Mean8.0%4.3%
Median6.8%3.8%
Interquartile 25% (IQ1)5.4%2.6%
Interquartile 75% (IQ3)9.5%5.0%
Interquartile Range (IQR)4.2%2.5%
Standard Deviation (Sample)4.2%2.4%
Standard Deviation (Population)4.1%2.4%

Similar Demographics by Married-Couple Family Poverty

Demographics Similar to Nicaraguans by Married-Couple Family Poverty

In terms of married-couple family poverty, the demographic groups most similar to Nicaraguans are Immigrants from Belize (6.7%, a difference of 0.15%), Immigrants from Guyana (6.7%, a difference of 0.55%), Kiowa (6.6%, a difference of 0.61%), U.S. Virgin Islander (6.6%, a difference of 0.62%), and Immigrants from Uzbekistan (6.6%, a difference of 0.73%).
DemographicsRating | RankMarried-Couple Family Poverty
Immigrants | Lebanon
0.0
/100
|
#292
Tragic
6.6%
Arapaho
0.0
/100
|
#293
Tragic
6.6%
Bahamians
0.0
/100
|
#294
Tragic
6.6%
Immigrants | Uzbekistan
0.0
/100
|
#295
Tragic
6.6%
U.S. Virgin Islanders
0.0
/100
|
#296
Tragic
6.6%
Kiowa
0.0
/100
|
#297
Tragic
6.6%
Immigrants | Guyana
0.0
/100
|
#298
Tragic
6.7%
Nicaraguans
0.0
/100
|
#299
Tragic
6.7%
Immigrants | Belize
0.0
/100
|
#300
Tragic
6.7%
Central Americans
0.0
/100
|
#301
Tragic
6.7%
Immigrants | Ecuador
0.0
/100
|
#302
Tragic
6.7%
Immigrants | El Salvador
0.0
/100
|
#303
Tragic
6.8%
Cubans
0.0
/100
|
#304
Tragic
6.8%
Haitians
0.0
/100
|
#305
Tragic
6.8%
Immigrants | Haiti
0.0
/100
|
#306
Tragic
7.0%

Demographics Similar to Immigrants from Zimbabwe by Married-Couple Family Poverty

In terms of married-couple family poverty, the demographic groups most similar to Immigrants from Zimbabwe are Immigrants from Netherlands (4.3%, a difference of 0.0%), Czechoslovakian (4.4%, a difference of 0.090%), French (4.3%, a difference of 0.16%), Austrian (4.3%, a difference of 0.18%), and Welsh (4.3%, a difference of 0.44%).
DemographicsRating | RankMarried-Couple Family Poverty
Turks
99.7
/100
|
#49
Exceptional
4.3%
Burmese
99.7
/100
|
#50
Exceptional
4.3%
Immigrants | Lithuania
99.7
/100
|
#51
Exceptional
4.3%
Russians
99.7
/100
|
#52
Exceptional
4.3%
Welsh
99.7
/100
|
#53
Exceptional
4.3%
Austrians
99.7
/100
|
#54
Exceptional
4.3%
French
99.7
/100
|
#55
Exceptional
4.3%
Immigrants | Zimbabwe
99.7
/100
|
#56
Exceptional
4.3%
Immigrants | Netherlands
99.7
/100
|
#57
Exceptional
4.3%
Czechoslovakians
99.7
/100
|
#58
Exceptional
4.4%
Immigrants | Sweden
99.6
/100
|
#59
Exceptional
4.4%
Tlingit-Haida
99.6
/100
|
#60
Exceptional
4.4%
Okinawans
99.6
/100
|
#61
Exceptional
4.4%
Immigrants | Australia
99.6
/100
|
#62
Exceptional
4.4%
Immigrants | Sri Lanka
99.6
/100
|
#63
Exceptional
4.4%