Sri Lankan vs Guamanian/Chamorro Single Mother Poverty
COMPARE
Sri Lankan
Guamanian/Chamorro
Single Mother Poverty
Single Mother Poverty Comparison
Sri Lankans
Guamanians/Chamorros
26.7%
SINGLE MOTHER POVERTY
99.9/ 100
METRIC RATING
39th/ 347
METRIC RANK
29.4%
SINGLE MOTHER POVERTY
31.8/ 100
METRIC RATING
188th/ 347
METRIC RANK
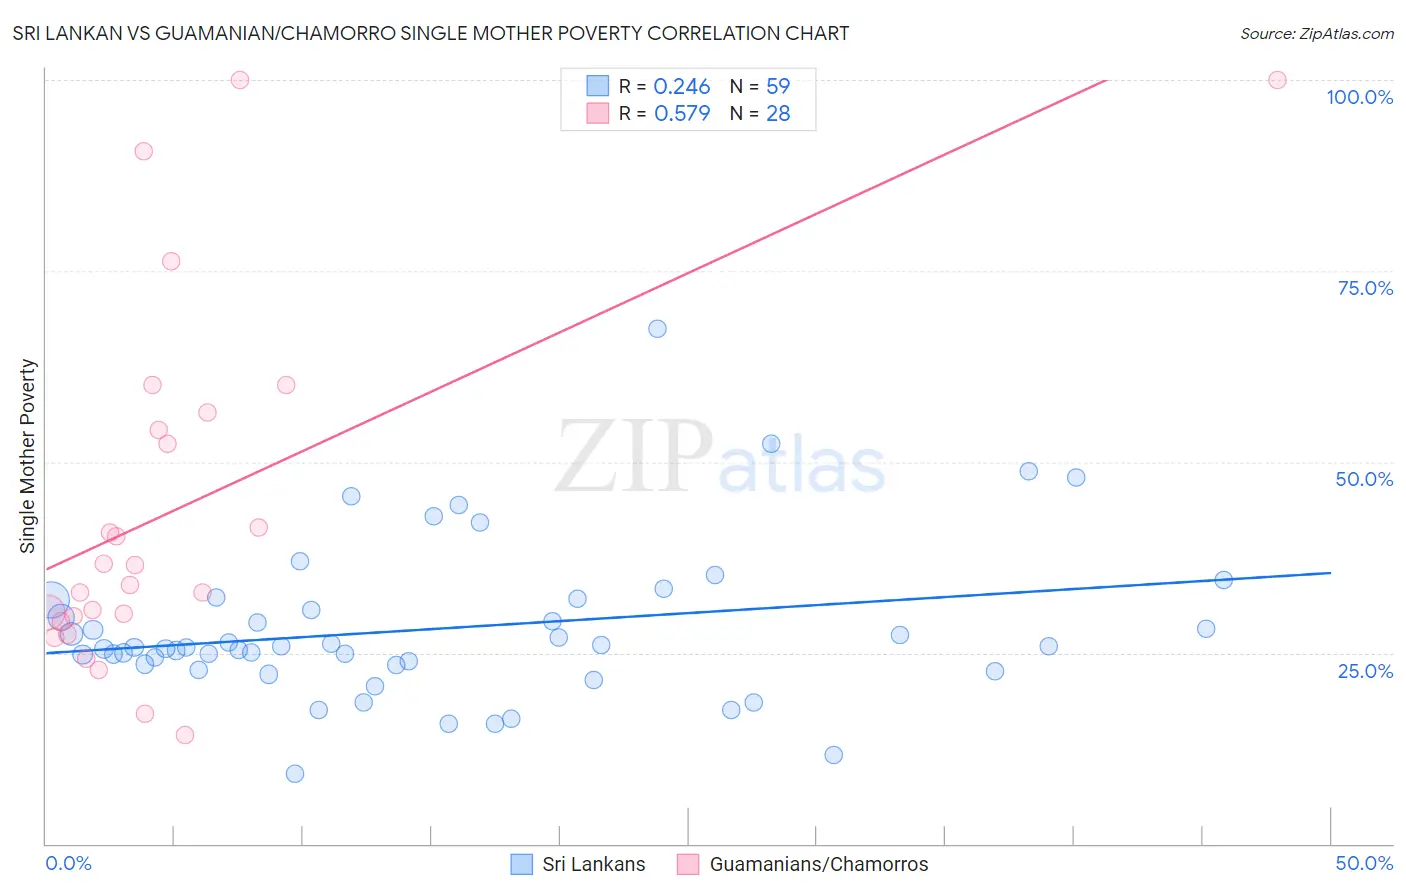
Sri Lankan vs Guamanian/Chamorro Single Mother Poverty Correlation Chart
The statistical analysis conducted on geographies consisting of 429,454,799 people shows a weak positive correlation between the proportion of Sri Lankans and poverty level among single mothers in the United States with a correlation coefficient (R) of 0.246 and weighted average of 26.7%. Similarly, the statistical analysis conducted on geographies consisting of 219,675,506 people shows a substantial positive correlation between the proportion of Guamanians/Chamorros and poverty level among single mothers in the United States with a correlation coefficient (R) of 0.579 and weighted average of 29.4%, a difference of 10.2%.
Single Mother Poverty Correlation Summary
| Measurement | Sri Lankan | Guamanian/Chamorro |
| Minimum | 9.1% | 14.3% |
| Maximum | 67.5% | 100.0% |
| Range | 58.4% | 85.7% |
| Mean | 28.2% | 43.9% |
| Median | 25.7% | 35.2% |
| Interquartile 25% (IQ1) | 23.5% | 29.4% |
| Interquartile 75% (IQ3) | 31.9% | 55.3% |
| Interquartile Range (IQR) | 8.4% | 25.8% |
| Standard Deviation (Sample) | 10.2% | 23.4% |
| Standard Deviation (Population) | 10.1% | 23.0% |
Similar Demographics by Single Mother Poverty
Demographics Similar to Sri Lankans by Single Mother Poverty
In terms of single mother poverty, the demographic groups most similar to Sri Lankans are Immigrants from Vietnam (26.7%, a difference of 0.090%), Immigrants from Greece (26.7%, a difference of 0.17%), Immigrants from Fiji (26.6%, a difference of 0.33%), Immigrants from Israel (26.6%, a difference of 0.37%), and Okinawan (26.6%, a difference of 0.38%).
| Demographics | Rating | Rank | Single Mother Poverty |
| Tongans | 99.9 /100 | #32 | Exceptional 26.5% |
| Bulgarians | 99.9 /100 | #33 | Exceptional 26.5% |
| Immigrants | Indonesia | 99.9 /100 | #34 | Exceptional 26.6% |
| Maltese | 99.9 /100 | #35 | Exceptional 26.6% |
| Okinawans | 99.9 /100 | #36 | Exceptional 26.6% |
| Immigrants | Israel | 99.9 /100 | #37 | Exceptional 26.6% |
| Immigrants | Fiji | 99.9 /100 | #38 | Exceptional 26.6% |
| Sri Lankans | 99.9 /100 | #39 | Exceptional 26.7% |
| Immigrants | Vietnam | 99.9 /100 | #40 | Exceptional 26.7% |
| Immigrants | Greece | 99.9 /100 | #41 | Exceptional 26.7% |
| Armenians | 99.9 /100 | #42 | Exceptional 26.8% |
| Tsimshian | 99.9 /100 | #43 | Exceptional 26.8% |
| Immigrants | Sierra Leone | 99.9 /100 | #44 | Exceptional 26.9% |
| Latvians | 99.9 /100 | #45 | Exceptional 26.9% |
| Immigrants | Serbia | 99.9 /100 | #46 | Exceptional 26.9% |
Demographics Similar to Guamanians/Chamorros by Single Mother Poverty
In terms of single mother poverty, the demographic groups most similar to Guamanians/Chamorros are Immigrants from Africa (29.4%, a difference of 0.010%), Lebanese (29.4%, a difference of 0.040%), Immigrants from Germany (29.5%, a difference of 0.070%), Immigrants from Trinidad and Tobago (29.5%, a difference of 0.14%), and Moroccan (29.5%, a difference of 0.18%).
| Demographics | Rating | Rank | Single Mother Poverty |
| Canadians | 40.4 /100 | #181 | Average 29.3% |
| Immigrants | Eastern Africa | 38.5 /100 | #182 | Fair 29.3% |
| Nepalese | 38.3 /100 | #183 | Fair 29.3% |
| Nigerians | 38.0 /100 | #184 | Fair 29.3% |
| Ghanaians | 36.8 /100 | #185 | Fair 29.4% |
| Yugoslavians | 36.0 /100 | #186 | Fair 29.4% |
| Lebanese | 32.5 /100 | #187 | Fair 29.4% |
| Guamanians/Chamorros | 31.8 /100 | #188 | Fair 29.4% |
| Immigrants | Africa | 31.6 /100 | #189 | Fair 29.4% |
| Immigrants | Germany | 30.4 /100 | #190 | Fair 29.5% |
| Immigrants | Trinidad and Tobago | 29.2 /100 | #191 | Fair 29.5% |
| Moroccans | 28.6 /100 | #192 | Fair 29.5% |
| Basques | 28.3 /100 | #193 | Fair 29.5% |
| Icelanders | 26.1 /100 | #194 | Fair 29.5% |
| Slavs | 24.5 /100 | #195 | Fair 29.6% |