Austrian vs Bermudan Poverty
COMPARE
Austrian
Bermudan
Poverty
Poverty Comparison
Austrians
Bermudans
11.2%
POVERTY
97.8/ 100
METRIC RATING
62nd/ 347
METRIC RANK
13.3%
POVERTY
3.7/ 100
METRIC RATING
214th/ 347
METRIC RANK
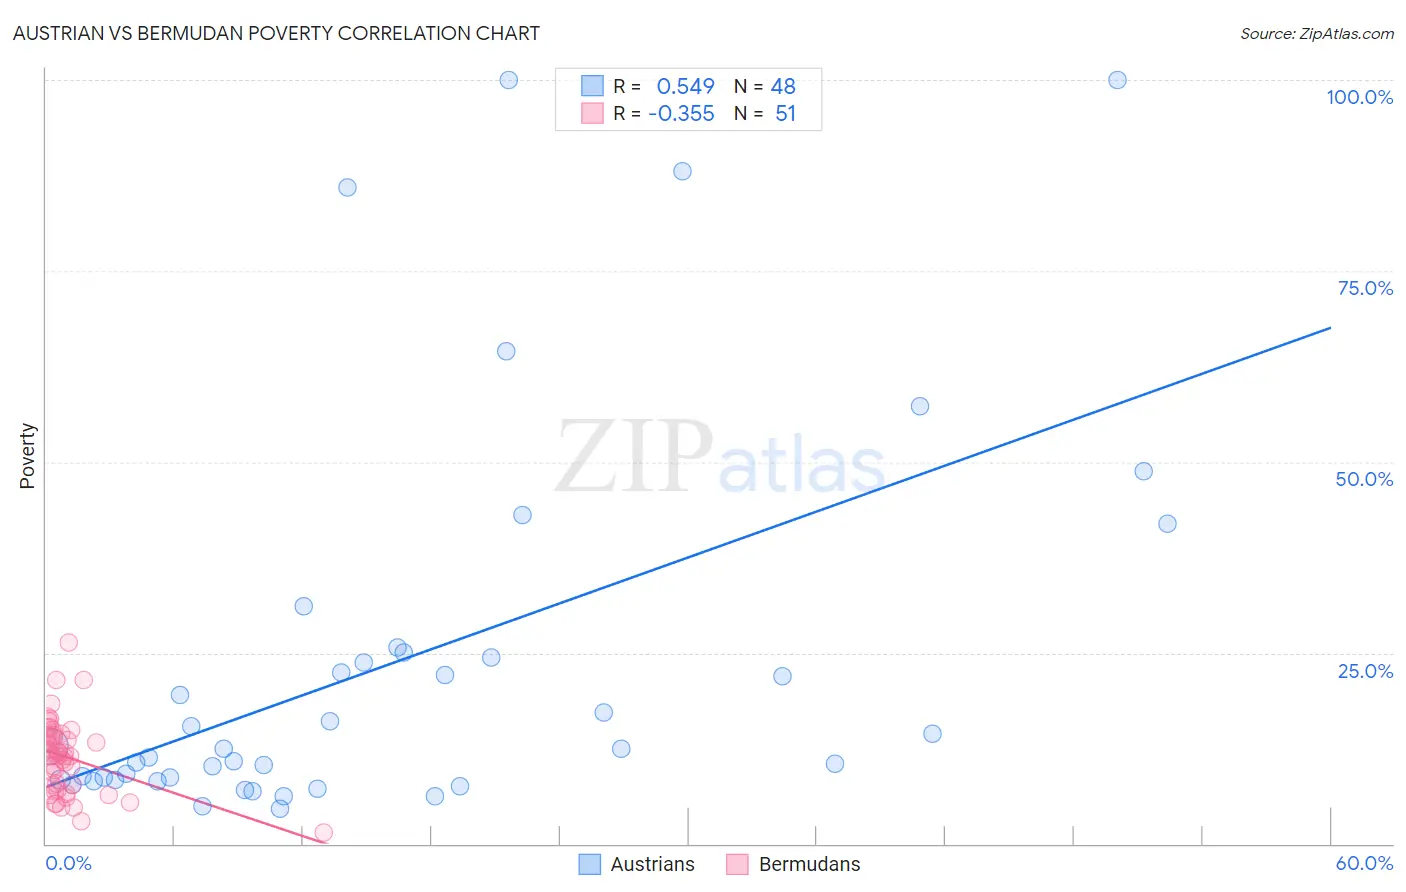
Austrian vs Bermudan Poverty Correlation Chart
The statistical analysis conducted on geographies consisting of 451,775,249 people shows a substantial positive correlation between the proportion of Austrians and poverty level in the United States with a correlation coefficient (R) of 0.549 and weighted average of 11.2%. Similarly, the statistical analysis conducted on geographies consisting of 55,716,155 people shows a mild negative correlation between the proportion of Bermudans and poverty level in the United States with a correlation coefficient (R) of -0.355 and weighted average of 13.3%, a difference of 18.9%.
Poverty Correlation Summary
| Measurement | Austrian | Bermudan |
| Minimum | 4.6% | 1.5% |
| Maximum | 100.0% | 26.3% |
| Range | 95.4% | 24.9% |
| Mean | 23.7% | 11.3% |
| Median | 12.5% | 11.5% |
| Interquartile 25% (IQ1) | 8.4% | 7.0% |
| Interquartile 75% (IQ3) | 24.7% | 14.3% |
| Interquartile Range (IQR) | 16.3% | 7.3% |
| Standard Deviation (Sample) | 25.3% | 4.9% |
| Standard Deviation (Population) | 25.0% | 4.9% |
Similar Demographics by Poverty
Demographics Similar to Austrians by Poverty
In terms of poverty, the demographic groups most similar to Austrians are Ukrainian (11.2%, a difference of 0.0%), Immigrants from Italy (11.2%, a difference of 0.030%), Immigrants from Sri Lanka (11.2%, a difference of 0.10%), Swiss (11.2%, a difference of 0.22%), and Immigrants from Europe (11.2%, a difference of 0.26%).
| Demographics | Rating | Rank | Poverty |
| Immigrants | Serbia | 98.5 /100 | #55 | Exceptional 11.1% |
| Estonians | 98.2 /100 | #56 | Exceptional 11.1% |
| Scandinavians | 98.2 /100 | #57 | Exceptional 11.1% |
| Germans | 98.1 /100 | #58 | Exceptional 11.1% |
| Immigrants | Europe | 98.0 /100 | #59 | Exceptional 11.2% |
| Immigrants | Sri Lanka | 97.9 /100 | #60 | Exceptional 11.2% |
| Immigrants | Italy | 97.9 /100 | #61 | Exceptional 11.2% |
| Austrians | 97.8 /100 | #62 | Exceptional 11.2% |
| Ukrainians | 97.8 /100 | #63 | Exceptional 11.2% |
| Swiss | 97.7 /100 | #64 | Exceptional 11.2% |
| Immigrants | Asia | 97.5 /100 | #65 | Exceptional 11.2% |
| Immigrants | Netherlands | 97.5 /100 | #66 | Exceptional 11.2% |
| Immigrants | Australia | 97.4 /100 | #67 | Exceptional 11.2% |
| Slovaks | 97.4 /100 | #68 | Exceptional 11.2% |
| Serbians | 97.4 /100 | #69 | Exceptional 11.2% |
Demographics Similar to Bermudans by Poverty
In terms of poverty, the demographic groups most similar to Bermudans are Immigrants from Panama (13.3%, a difference of 0.25%), Japanese (13.3%, a difference of 0.26%), Nonimmigrants (13.3%, a difference of 0.26%), Immigrants from Uzbekistan (13.3%, a difference of 0.30%), and Immigrants from Thailand (13.3%, a difference of 0.36%).
| Demographics | Rating | Rank | Poverty |
| Panamanians | 6.6 /100 | #207 | Tragic 13.1% |
| Ugandans | 6.2 /100 | #208 | Tragic 13.1% |
| Malaysians | 6.1 /100 | #209 | Tragic 13.1% |
| Immigrants | Azores | 6.1 /100 | #210 | Tragic 13.1% |
| Moroccans | 5.2 /100 | #211 | Tragic 13.2% |
| Immigrants | Immigrants | 4.3 /100 | #212 | Tragic 13.2% |
| Immigrants | Panama | 4.1 /100 | #213 | Tragic 13.3% |
| Bermudans | 3.7 /100 | #214 | Tragic 13.3% |
| Japanese | 3.3 /100 | #215 | Tragic 13.3% |
| Immigrants | Nonimmigrants | 3.3 /100 | #216 | Tragic 13.3% |
| Immigrants | Uzbekistan | 3.2 /100 | #217 | Tragic 13.3% |
| Immigrants | Thailand | 3.1 /100 | #218 | Tragic 13.3% |
| Immigrants | Cambodia | 3.0 /100 | #219 | Tragic 13.4% |
| Americans | 2.9 /100 | #220 | Tragic 13.4% |
| Alsatians | 2.6 /100 | #221 | Tragic 13.4% |