Native/Alaskan vs Immigrants from Pakistan Poverty
COMPARE
Native/Alaskan
Immigrants from Pakistan
Poverty
Poverty Comparison
Natives/Alaskans
Immigrants from Pakistan
18.1%
POVERTY
0.0/ 100
METRIC RATING
332nd/ 347
METRIC RANK
10.8%
POVERTY
99.3/ 100
METRIC RATING
39th/ 347
METRIC RANK
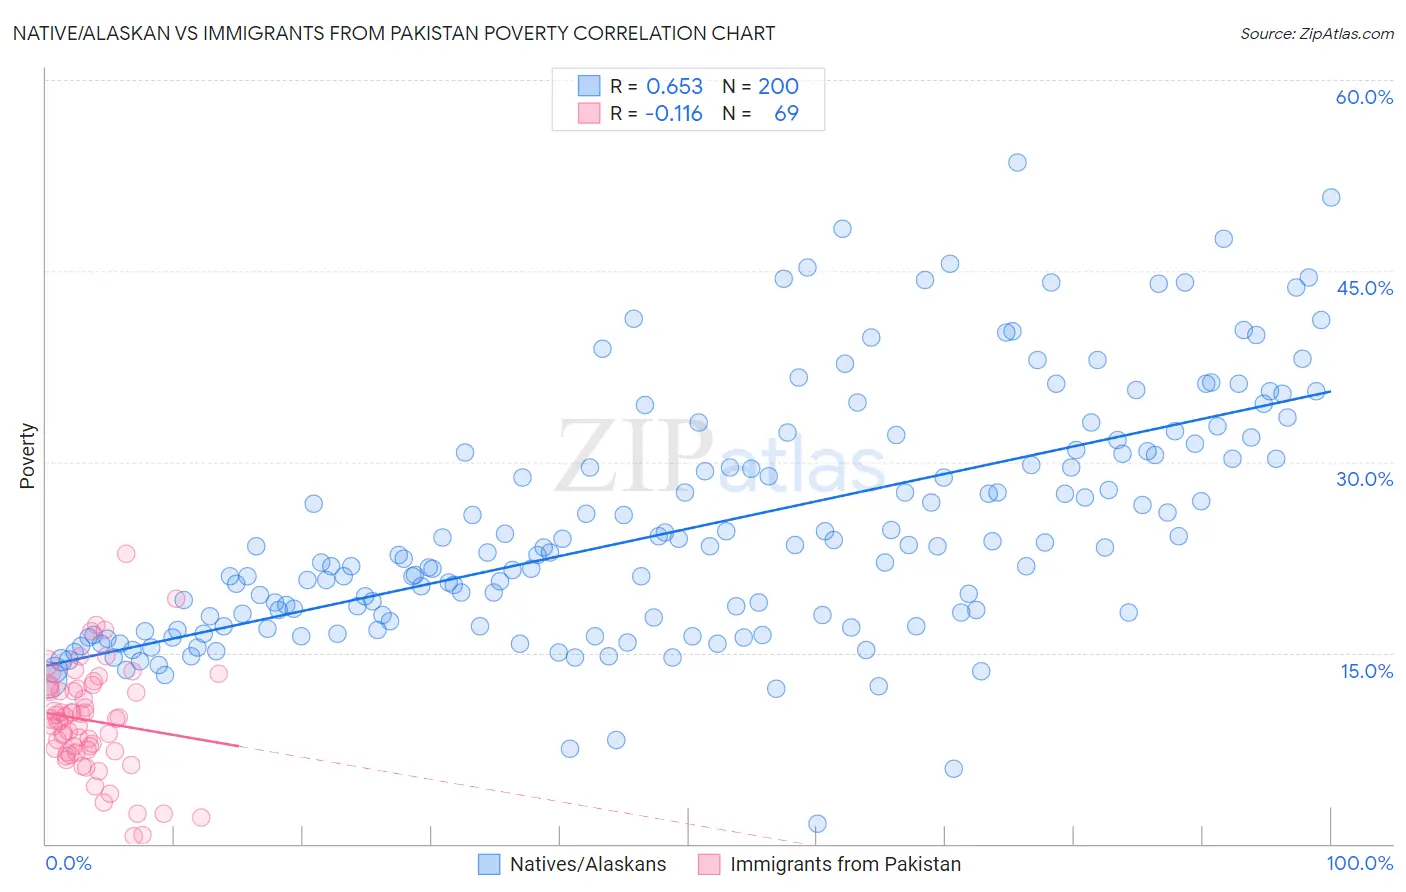
Native/Alaskan vs Immigrants from Pakistan Poverty Correlation Chart
The statistical analysis conducted on geographies consisting of 512,638,915 people shows a significant positive correlation between the proportion of Natives/Alaskans and poverty level in the United States with a correlation coefficient (R) of 0.653 and weighted average of 18.1%. Similarly, the statistical analysis conducted on geographies consisting of 283,811,993 people shows a poor negative correlation between the proportion of Immigrants from Pakistan and poverty level in the United States with a correlation coefficient (R) of -0.116 and weighted average of 10.8%, a difference of 66.5%.
Poverty Correlation Summary
| Measurement | Native/Alaskan | Immigrants from Pakistan |
| Minimum | 1.6% | 0.64% |
| Maximum | 53.5% | 22.7% |
| Range | 51.9% | 22.1% |
| Mean | 24.8% | 9.7% |
| Median | 22.8% | 9.8% |
| Interquartile 25% (IQ1) | 17.1% | 7.2% |
| Interquartile 75% (IQ3) | 30.7% | 12.2% |
| Interquartile Range (IQR) | 13.6% | 5.0% |
| Standard Deviation (Sample) | 9.6% | 4.2% |
| Standard Deviation (Population) | 9.5% | 4.1% |
Similar Demographics by Poverty
Demographics Similar to Natives/Alaskans by Poverty
In terms of poverty, the demographic groups most similar to Natives/Alaskans are Immigrants from Dominican Republic (17.8%, a difference of 1.4%), Houma (18.4%, a difference of 2.0%), Apache (18.4%, a difference of 2.0%), Dominican (17.6%, a difference of 2.4%), and Black/African American (17.3%, a difference of 4.7%).
| Demographics | Rating | Rank | Poverty |
| Central American Indians | 0.0 /100 | #325 | Tragic 16.7% |
| Paiute | 0.0 /100 | #326 | Tragic 16.7% |
| Kiowa | 0.0 /100 | #327 | Tragic 16.8% |
| Ute | 0.0 /100 | #328 | Tragic 16.9% |
| Blacks/African Americans | 0.0 /100 | #329 | Tragic 17.3% |
| Dominicans | 0.0 /100 | #330 | Tragic 17.6% |
| Immigrants | Dominican Republic | 0.0 /100 | #331 | Tragic 17.8% |
| Natives/Alaskans | 0.0 /100 | #332 | Tragic 18.1% |
| Houma | 0.0 /100 | #333 | Tragic 18.4% |
| Apache | 0.0 /100 | #334 | Tragic 18.4% |
| Cheyenne | 0.0 /100 | #335 | Tragic 18.9% |
| Pueblo | 0.0 /100 | #336 | Tragic 19.4% |
| Sioux | 0.0 /100 | #337 | Tragic 19.8% |
| Yuman | 0.0 /100 | #338 | Tragic 20.2% |
| Crow | 0.0 /100 | #339 | Tragic 20.7% |
Demographics Similar to Immigrants from Pakistan by Poverty
In terms of poverty, the demographic groups most similar to Immigrants from Pakistan are Russian (10.9%, a difference of 0.050%), Czech (10.8%, a difference of 0.080%), Immigrants from Greece (10.8%, a difference of 0.13%), Immigrants from Iran (10.9%, a difference of 0.14%), and Cypriot (10.8%, a difference of 0.22%).
| Demographics | Rating | Rank | Poverty |
| Iranians | 99.5 /100 | #32 | Exceptional 10.7% |
| Macedonians | 99.4 /100 | #33 | Exceptional 10.8% |
| Immigrants | Poland | 99.4 /100 | #34 | Exceptional 10.8% |
| Tongans | 99.4 /100 | #35 | Exceptional 10.8% |
| Cypriots | 99.3 /100 | #36 | Exceptional 10.8% |
| Immigrants | Greece | 99.3 /100 | #37 | Exceptional 10.8% |
| Czechs | 99.3 /100 | #38 | Exceptional 10.8% |
| Immigrants | Pakistan | 99.3 /100 | #39 | Exceptional 10.8% |
| Russians | 99.3 /100 | #40 | Exceptional 10.9% |
| Immigrants | Iran | 99.2 /100 | #41 | Exceptional 10.9% |
| Koreans | 99.2 /100 | #42 | Exceptional 10.9% |
| Immigrants | Singapore | 99.2 /100 | #43 | Exceptional 10.9% |
| Immigrants | Moldova | 99.1 /100 | #44 | Exceptional 10.9% |
| Turks | 98.9 /100 | #45 | Exceptional 11.0% |
| Immigrants | Czechoslovakia | 98.9 /100 | #46 | Exceptional 11.0% |