Immigrants from Latvia vs Bermudan Poverty
COMPARE
Immigrants from Latvia
Bermudan
Poverty
Poverty Comparison
Immigrants from Latvia
Bermudans
11.5%
POVERTY
94.5/ 100
METRIC RATING
98th/ 347
METRIC RANK
13.3%
POVERTY
3.7/ 100
METRIC RATING
214th/ 347
METRIC RANK
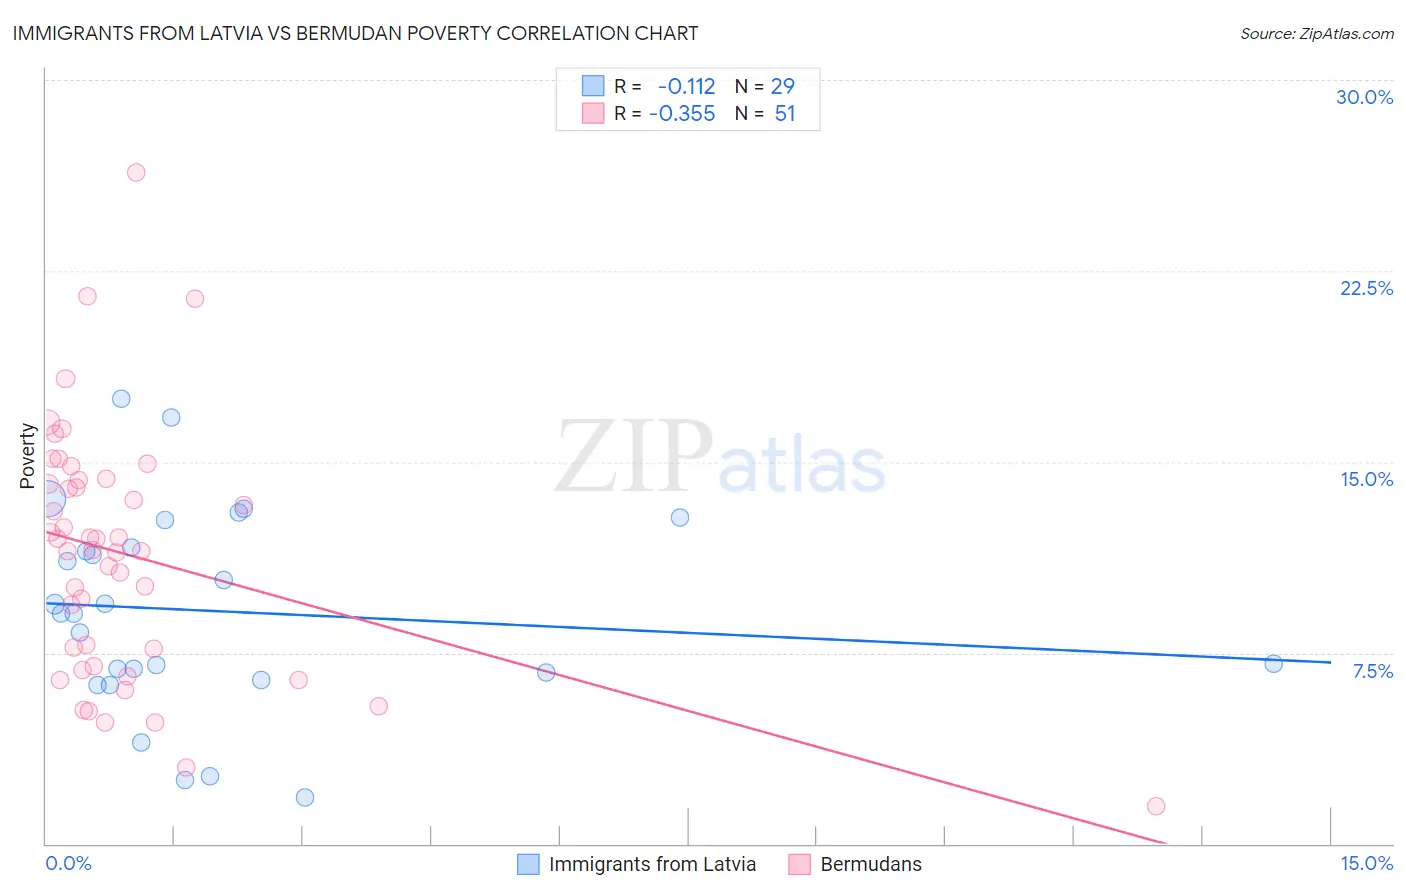
Immigrants from Latvia vs Bermudan Poverty Correlation Chart
The statistical analysis conducted on geographies consisting of 113,731,697 people shows a poor negative correlation between the proportion of Immigrants from Latvia and poverty level in the United States with a correlation coefficient (R) of -0.112 and weighted average of 11.5%. Similarly, the statistical analysis conducted on geographies consisting of 55,716,155 people shows a mild negative correlation between the proportion of Bermudans and poverty level in the United States with a correlation coefficient (R) of -0.355 and weighted average of 13.3%, a difference of 15.9%.
Poverty Correlation Summary
| Measurement | Immigrants from Latvia | Bermudan |
| Minimum | 1.8% | 1.5% |
| Maximum | 17.5% | 26.3% |
| Range | 15.6% | 24.9% |
| Mean | 9.1% | 11.3% |
| Median | 9.1% | 11.5% |
| Interquartile 25% (IQ1) | 6.6% | 7.0% |
| Interquartile 75% (IQ3) | 12.2% | 14.3% |
| Interquartile Range (IQR) | 5.6% | 7.3% |
| Standard Deviation (Sample) | 4.0% | 4.9% |
| Standard Deviation (Population) | 3.9% | 4.9% |
Similar Demographics by Poverty
Demographics Similar to Immigrants from Latvia by Poverty
In terms of poverty, the demographic groups most similar to Immigrants from Latvia are Immigrants from Egypt (11.5%, a difference of 0.030%), Immigrants from South Africa (11.5%, a difference of 0.070%), Immigrants from Indonesia (11.5%, a difference of 0.14%), Paraguayan (11.4%, a difference of 0.19%), and Australian (11.4%, a difference of 0.19%).
| Demographics | Rating | Rank | Poverty |
| Finns | 95.2 /100 | #91 | Exceptional 11.4% |
| British | 95.0 /100 | #92 | Exceptional 11.4% |
| Romanians | 94.9 /100 | #93 | Exceptional 11.4% |
| Paraguayans | 94.9 /100 | #94 | Exceptional 11.4% |
| Australians | 94.9 /100 | #95 | Exceptional 11.4% |
| Immigrants | South Africa | 94.7 /100 | #96 | Exceptional 11.5% |
| Immigrants | Egypt | 94.6 /100 | #97 | Exceptional 11.5% |
| Immigrants | Latvia | 94.5 /100 | #98 | Exceptional 11.5% |
| Immigrants | Indonesia | 94.2 /100 | #99 | Exceptional 11.5% |
| Scottish | 94.0 /100 | #100 | Exceptional 11.5% |
| Slavs | 93.3 /100 | #101 | Exceptional 11.5% |
| Laotians | 92.4 /100 | #102 | Exceptional 11.6% |
| Okinawans | 92.4 /100 | #103 | Exceptional 11.6% |
| Native Hawaiians | 92.1 /100 | #104 | Exceptional 11.6% |
| Portuguese | 92.1 /100 | #105 | Exceptional 11.6% |
Demographics Similar to Bermudans by Poverty
In terms of poverty, the demographic groups most similar to Bermudans are Immigrants from Panama (13.3%, a difference of 0.25%), Japanese (13.3%, a difference of 0.26%), Nonimmigrants (13.3%, a difference of 0.26%), Immigrants from Uzbekistan (13.3%, a difference of 0.30%), and Immigrants from Thailand (13.3%, a difference of 0.36%).
| Demographics | Rating | Rank | Poverty |
| Panamanians | 6.6 /100 | #207 | Tragic 13.1% |
| Ugandans | 6.2 /100 | #208 | Tragic 13.1% |
| Malaysians | 6.1 /100 | #209 | Tragic 13.1% |
| Immigrants | Azores | 6.1 /100 | #210 | Tragic 13.1% |
| Moroccans | 5.2 /100 | #211 | Tragic 13.2% |
| Immigrants | Immigrants | 4.3 /100 | #212 | Tragic 13.2% |
| Immigrants | Panama | 4.1 /100 | #213 | Tragic 13.3% |
| Bermudans | 3.7 /100 | #214 | Tragic 13.3% |
| Japanese | 3.3 /100 | #215 | Tragic 13.3% |
| Immigrants | Nonimmigrants | 3.3 /100 | #216 | Tragic 13.3% |
| Immigrants | Uzbekistan | 3.2 /100 | #217 | Tragic 13.3% |
| Immigrants | Thailand | 3.1 /100 | #218 | Tragic 13.3% |
| Immigrants | Cambodia | 3.0 /100 | #219 | Tragic 13.4% |
| Americans | 2.9 /100 | #220 | Tragic 13.4% |
| Alsatians | 2.6 /100 | #221 | Tragic 13.4% |