Immigrants from Jordan vs Bermudan Poverty
COMPARE
Immigrants from Jordan
Bermudan
Poverty
Poverty Comparison
Immigrants from Jordan
Bermudans
11.9%
POVERTY
82.4/ 100
METRIC RATING
138th/ 347
METRIC RANK
13.3%
POVERTY
3.7/ 100
METRIC RATING
214th/ 347
METRIC RANK
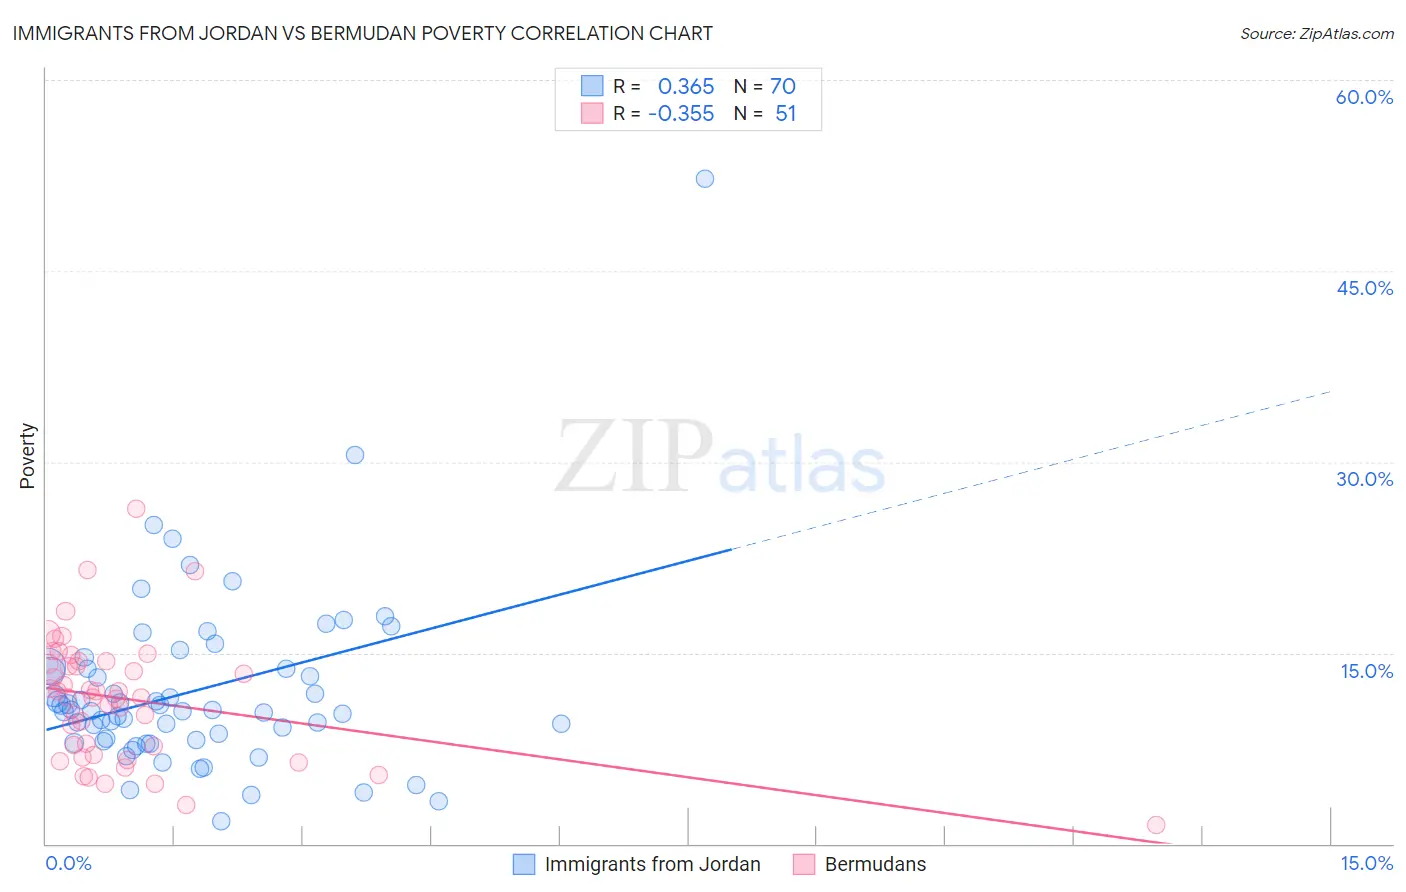
Immigrants from Jordan vs Bermudan Poverty Correlation Chart
The statistical analysis conducted on geographies consisting of 181,257,123 people shows a mild positive correlation between the proportion of Immigrants from Jordan and poverty level in the United States with a correlation coefficient (R) of 0.365 and weighted average of 11.9%. Similarly, the statistical analysis conducted on geographies consisting of 55,716,155 people shows a mild negative correlation between the proportion of Bermudans and poverty level in the United States with a correlation coefficient (R) of -0.355 and weighted average of 13.3%, a difference of 12.1%.
Poverty Correlation Summary
| Measurement | Immigrants from Jordan | Bermudan |
| Minimum | 1.8% | 1.5% |
| Maximum | 52.2% | 26.3% |
| Range | 50.4% | 24.9% |
| Mean | 12.0% | 11.3% |
| Median | 10.5% | 11.5% |
| Interquartile 25% (IQ1) | 8.1% | 7.0% |
| Interquartile 75% (IQ3) | 13.8% | 14.3% |
| Interquartile Range (IQR) | 5.6% | 7.3% |
| Standard Deviation (Sample) | 7.2% | 4.9% |
| Standard Deviation (Population) | 7.1% | 4.9% |
Similar Demographics by Poverty
Demographics Similar to Immigrants from Jordan by Poverty
In terms of poverty, the demographic groups most similar to Immigrants from Jordan are Pakistani (11.9%, a difference of 0.030%), Immigrants from Switzerland (11.8%, a difference of 0.11%), Immigrants from Peru (11.9%, a difference of 0.22%), Immigrants from France (11.9%, a difference of 0.31%), and Chilean (11.8%, a difference of 0.32%).
| Demographics | Rating | Rank | Poverty |
| French | 86.1 /100 | #131 | Excellent 11.8% |
| Peruvians | 85.6 /100 | #132 | Excellent 11.8% |
| Immigrants | Western Europe | 85.2 /100 | #133 | Excellent 11.8% |
| Yugoslavians | 85.2 /100 | #134 | Excellent 11.8% |
| Immigrants | Vietnam | 85.2 /100 | #135 | Excellent 11.8% |
| Chileans | 84.2 /100 | #136 | Excellent 11.8% |
| Immigrants | Switzerland | 83.0 /100 | #137 | Excellent 11.8% |
| Immigrants | Jordan | 82.4 /100 | #138 | Excellent 11.9% |
| Pakistanis | 82.2 /100 | #139 | Excellent 11.9% |
| Immigrants | Peru | 81.1 /100 | #140 | Excellent 11.9% |
| Immigrants | France | 80.5 /100 | #141 | Excellent 11.9% |
| Basques | 80.4 /100 | #142 | Excellent 11.9% |
| Brazilians | 79.7 /100 | #143 | Good 11.9% |
| Icelanders | 77.9 /100 | #144 | Good 11.9% |
| Syrians | 75.1 /100 | #145 | Good 12.0% |
Demographics Similar to Bermudans by Poverty
In terms of poverty, the demographic groups most similar to Bermudans are Immigrants from Panama (13.3%, a difference of 0.25%), Japanese (13.3%, a difference of 0.26%), Nonimmigrants (13.3%, a difference of 0.26%), Immigrants from Uzbekistan (13.3%, a difference of 0.30%), and Immigrants from Thailand (13.3%, a difference of 0.36%).
| Demographics | Rating | Rank | Poverty |
| Panamanians | 6.6 /100 | #207 | Tragic 13.1% |
| Ugandans | 6.2 /100 | #208 | Tragic 13.1% |
| Malaysians | 6.1 /100 | #209 | Tragic 13.1% |
| Immigrants | Azores | 6.1 /100 | #210 | Tragic 13.1% |
| Moroccans | 5.2 /100 | #211 | Tragic 13.2% |
| Immigrants | Immigrants | 4.3 /100 | #212 | Tragic 13.2% |
| Immigrants | Panama | 4.1 /100 | #213 | Tragic 13.3% |
| Bermudans | 3.7 /100 | #214 | Tragic 13.3% |
| Japanese | 3.3 /100 | #215 | Tragic 13.3% |
| Immigrants | Nonimmigrants | 3.3 /100 | #216 | Tragic 13.3% |
| Immigrants | Uzbekistan | 3.2 /100 | #217 | Tragic 13.3% |
| Immigrants | Thailand | 3.1 /100 | #218 | Tragic 13.3% |
| Immigrants | Cambodia | 3.0 /100 | #219 | Tragic 13.4% |
| Americans | 2.9 /100 | #220 | Tragic 13.4% |
| Alsatians | 2.6 /100 | #221 | Tragic 13.4% |