Native/Alaskan vs Iraqi Poverty
COMPARE
Native/Alaskan
Iraqi
Poverty
Poverty Comparison
Natives/Alaskans
Iraqis
18.1%
POVERTY
0.0/ 100
METRIC RATING
332nd/ 347
METRIC RANK
12.7%
POVERTY
20.8/ 100
METRIC RATING
196th/ 347
METRIC RANK
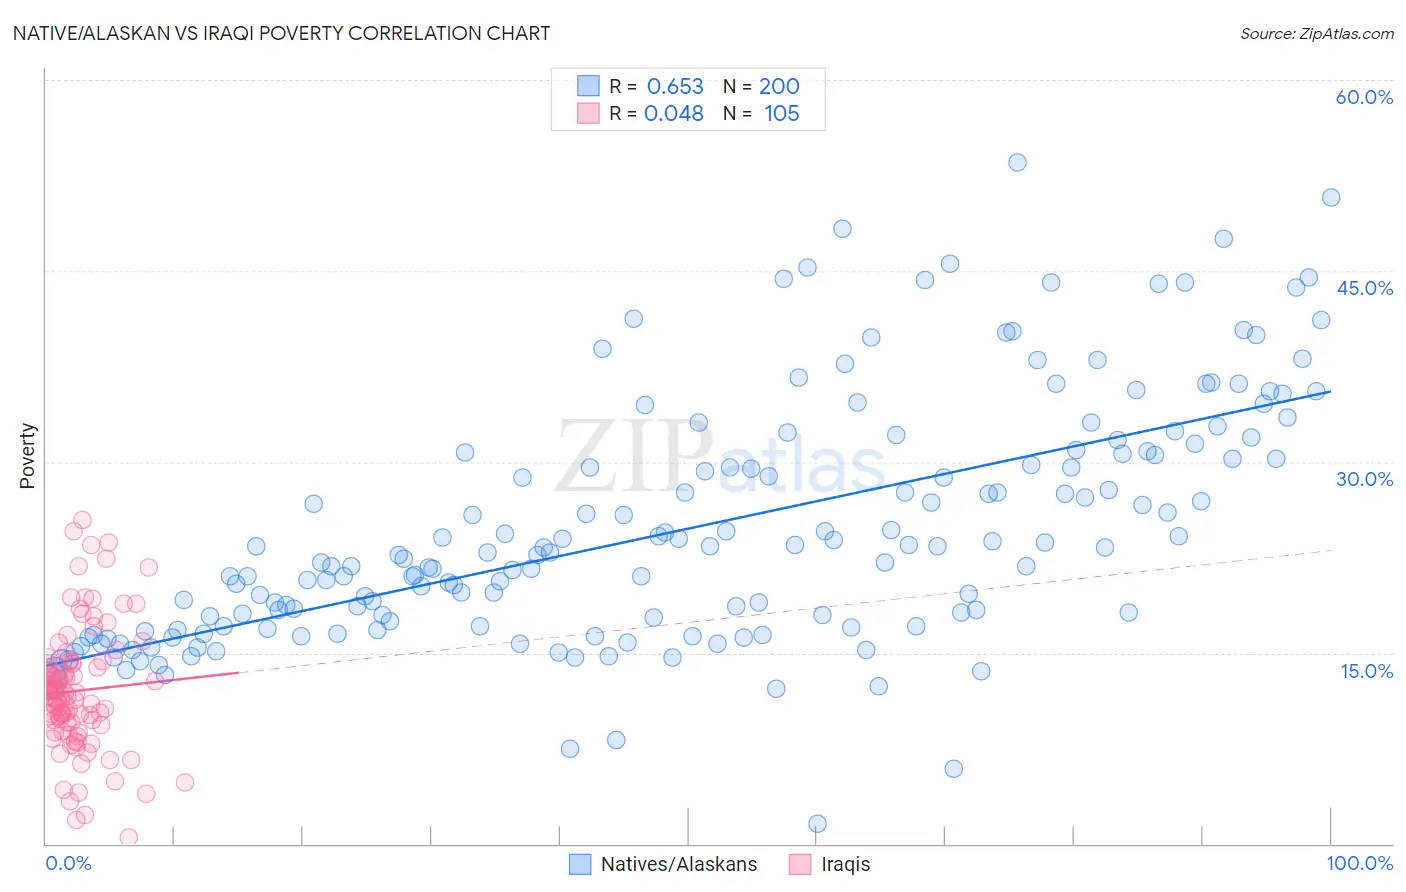
Native/Alaskan vs Iraqi Poverty Correlation Chart
The statistical analysis conducted on geographies consisting of 512,638,915 people shows a significant positive correlation between the proportion of Natives/Alaskans and poverty level in the United States with a correlation coefficient (R) of 0.653 and weighted average of 18.1%. Similarly, the statistical analysis conducted on geographies consisting of 170,596,700 people shows no correlation between the proportion of Iraqis and poverty level in the United States with a correlation coefficient (R) of 0.048 and weighted average of 12.7%, a difference of 42.0%.
Poverty Correlation Summary
| Measurement | Native/Alaskan | Iraqi |
| Minimum | 1.6% | 0.47% |
| Maximum | 53.5% | 25.4% |
| Range | 51.9% | 25.0% |
| Mean | 24.8% | 12.0% |
| Median | 22.8% | 11.5% |
| Interquartile 25% (IQ1) | 17.1% | 9.4% |
| Interquartile 75% (IQ3) | 30.7% | 14.2% |
| Interquartile Range (IQR) | 13.6% | 4.8% |
| Standard Deviation (Sample) | 9.6% | 4.9% |
| Standard Deviation (Population) | 9.5% | 4.9% |
Similar Demographics by Poverty
Demographics Similar to Natives/Alaskans by Poverty
In terms of poverty, the demographic groups most similar to Natives/Alaskans are Immigrants from Dominican Republic (17.8%, a difference of 1.4%), Houma (18.4%, a difference of 2.0%), Apache (18.4%, a difference of 2.0%), Dominican (17.6%, a difference of 2.4%), and Black/African American (17.3%, a difference of 4.7%).
| Demographics | Rating | Rank | Poverty |
| Central American Indians | 0.0 /100 | #325 | Tragic 16.7% |
| Paiute | 0.0 /100 | #326 | Tragic 16.7% |
| Kiowa | 0.0 /100 | #327 | Tragic 16.8% |
| Ute | 0.0 /100 | #328 | Tragic 16.9% |
| Blacks/African Americans | 0.0 /100 | #329 | Tragic 17.3% |
| Dominicans | 0.0 /100 | #330 | Tragic 17.6% |
| Immigrants | Dominican Republic | 0.0 /100 | #331 | Tragic 17.8% |
| Natives/Alaskans | 0.0 /100 | #332 | Tragic 18.1% |
| Houma | 0.0 /100 | #333 | Tragic 18.4% |
| Apache | 0.0 /100 | #334 | Tragic 18.4% |
| Cheyenne | 0.0 /100 | #335 | Tragic 18.9% |
| Pueblo | 0.0 /100 | #336 | Tragic 19.4% |
| Sioux | 0.0 /100 | #337 | Tragic 19.8% |
| Yuman | 0.0 /100 | #338 | Tragic 20.2% |
| Crow | 0.0 /100 | #339 | Tragic 20.7% |
Demographics Similar to Iraqis by Poverty
In terms of poverty, the demographic groups most similar to Iraqis are Immigrants from Kuwait (12.7%, a difference of 0.020%), Arab (12.7%, a difference of 0.050%), Delaware (12.7%, a difference of 0.090%), Immigrants from Lebanon (12.8%, a difference of 0.31%), and Spanish (12.8%, a difference of 0.31%).
| Demographics | Rating | Rank | Poverty |
| Aleuts | 33.2 /100 | #189 | Fair 12.5% |
| Immigrants | South America | 32.3 /100 | #190 | Fair 12.5% |
| Sierra Leoneans | 31.5 /100 | #191 | Fair 12.6% |
| South American Indians | 23.3 /100 | #192 | Fair 12.7% |
| Delaware | 21.4 /100 | #193 | Fair 12.7% |
| Arabs | 21.1 /100 | #194 | Fair 12.7% |
| Immigrants | Kuwait | 20.9 /100 | #195 | Fair 12.7% |
| Iraqis | 20.8 /100 | #196 | Fair 12.7% |
| Immigrants | Lebanon | 18.7 /100 | #197 | Poor 12.8% |
| Spanish | 18.7 /100 | #198 | Poor 12.8% |
| Immigrants | Kenya | 17.5 /100 | #199 | Poor 12.8% |
| Spaniards | 16.5 /100 | #200 | Poor 12.8% |
| Immigrants | Uganda | 16.5 /100 | #201 | Poor 12.8% |
| Immigrants | Uruguay | 15.6 /100 | #202 | Poor 12.8% |
| Hmong | 15.0 /100 | #203 | Poor 12.8% |