Malaysian vs Bermudan Poverty
COMPARE
Malaysian
Bermudan
Poverty
Poverty Comparison
Malaysians
Bermudans
13.1%
POVERTY
6.1/ 100
METRIC RATING
209th/ 347
METRIC RANK
13.3%
POVERTY
3.7/ 100
METRIC RATING
214th/ 347
METRIC RANK
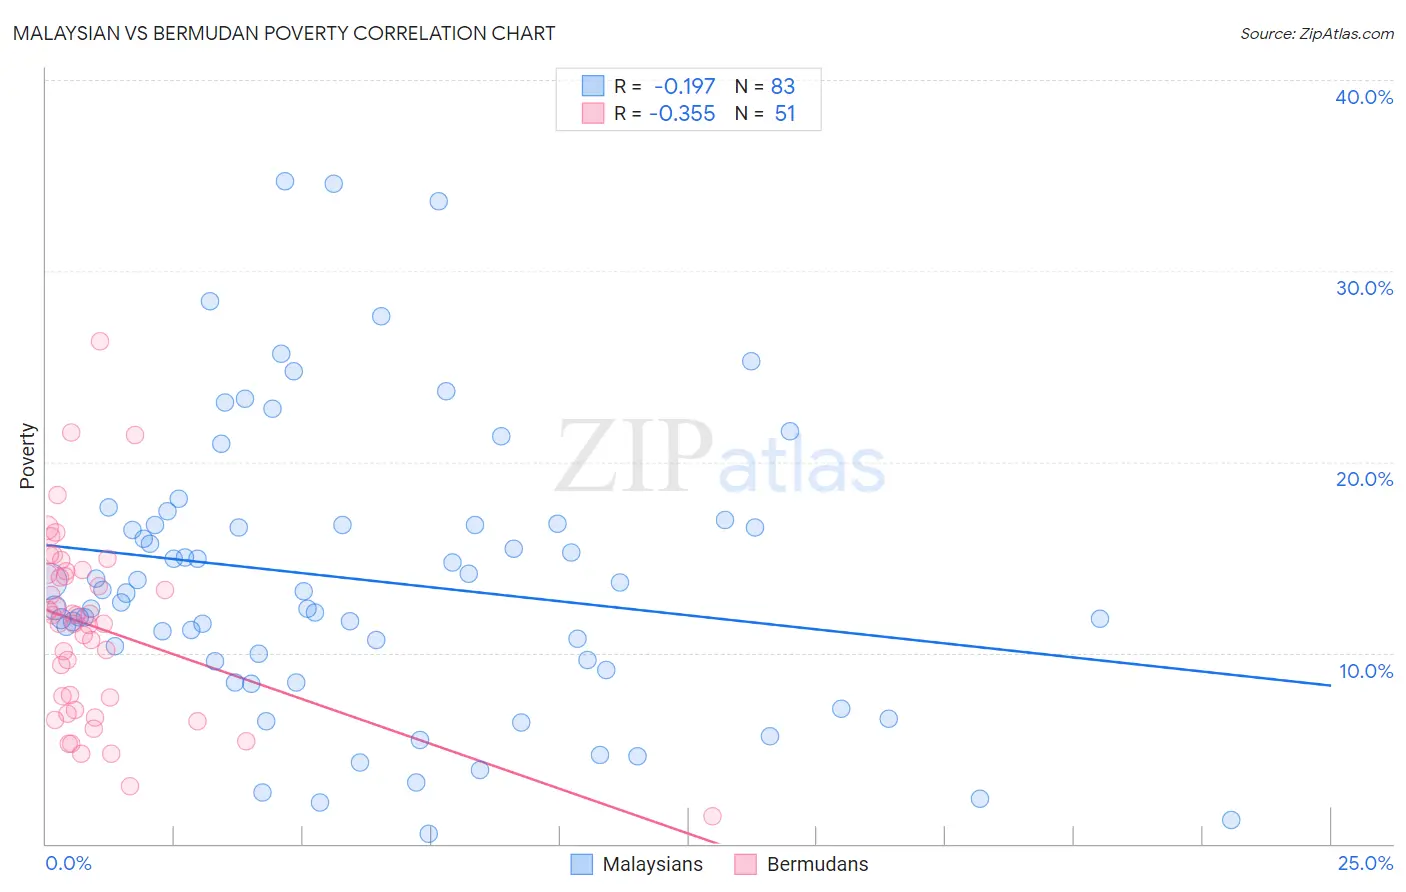
Malaysian vs Bermudan Poverty Correlation Chart
The statistical analysis conducted on geographies consisting of 226,011,043 people shows a poor negative correlation between the proportion of Malaysians and poverty level in the United States with a correlation coefficient (R) of -0.197 and weighted average of 13.1%. Similarly, the statistical analysis conducted on geographies consisting of 55,716,155 people shows a mild negative correlation between the proportion of Bermudans and poverty level in the United States with a correlation coefficient (R) of -0.355 and weighted average of 13.3%, a difference of 1.2%.
Poverty Correlation Summary
| Measurement | Malaysian | Bermudan |
| Minimum | 0.56% | 1.5% |
| Maximum | 34.7% | 26.3% |
| Range | 34.2% | 24.9% |
| Mean | 13.8% | 11.3% |
| Median | 13.1% | 11.5% |
| Interquartile 25% (IQ1) | 9.6% | 7.0% |
| Interquartile 75% (IQ3) | 16.7% | 14.3% |
| Interquartile Range (IQR) | 7.1% | 7.3% |
| Standard Deviation (Sample) | 7.4% | 4.9% |
| Standard Deviation (Population) | 7.4% | 4.9% |
Demographics Similar to Malaysians and Bermudans by Poverty
In terms of poverty, the demographic groups most similar to Malaysians are Ugandan (13.1%, a difference of 0.030%), Immigrants from the Azores (13.1%, a difference of 0.030%), Panamanian (13.1%, a difference of 0.18%), Immigrants from Eastern Africa (13.1%, a difference of 0.30%), and Moroccan (13.2%, a difference of 0.38%). Similarly, the demographic groups most similar to Bermudans are Immigrants from Panama (13.3%, a difference of 0.25%), Japanese (13.3%, a difference of 0.26%), Nonimmigrants (13.3%, a difference of 0.26%), Immigrants from Uzbekistan (13.3%, a difference of 0.30%), and Immigrants from Thailand (13.3%, a difference of 0.36%).
| Demographics | Rating | Rank | Poverty |
| Immigrants | Uganda | 16.5 /100 | #201 | Poor 12.8% |
| Immigrants | Uruguay | 15.6 /100 | #202 | Poor 12.8% |
| Hmong | 15.0 /100 | #203 | Poor 12.8% |
| Immigrants | Western Asia | 14.1 /100 | #204 | Poor 12.9% |
| Tsimshian | 9.2 /100 | #205 | Tragic 13.0% |
| Immigrants | Eastern Africa | 7.0 /100 | #206 | Tragic 13.1% |
| Panamanians | 6.6 /100 | #207 | Tragic 13.1% |
| Ugandans | 6.2 /100 | #208 | Tragic 13.1% |
| Malaysians | 6.1 /100 | #209 | Tragic 13.1% |
| Immigrants | Azores | 6.1 /100 | #210 | Tragic 13.1% |
| Moroccans | 5.2 /100 | #211 | Tragic 13.2% |
| Immigrants | Immigrants | 4.3 /100 | #212 | Tragic 13.2% |
| Immigrants | Panama | 4.1 /100 | #213 | Tragic 13.3% |
| Bermudans | 3.7 /100 | #214 | Tragic 13.3% |
| Japanese | 3.3 /100 | #215 | Tragic 13.3% |
| Immigrants | Nonimmigrants | 3.3 /100 | #216 | Tragic 13.3% |
| Immigrants | Uzbekistan | 3.2 /100 | #217 | Tragic 13.3% |
| Immigrants | Thailand | 3.1 /100 | #218 | Tragic 13.3% |
| Immigrants | Cambodia | 3.0 /100 | #219 | Tragic 13.4% |
| Americans | 2.9 /100 | #220 | Tragic 13.4% |
| Alsatians | 2.6 /100 | #221 | Tragic 13.4% |