French Canadian vs Chippewa Child Poverty Among Girls Under 16
COMPARE
French Canadian
Chippewa
Child Poverty Among Girls Under 16
Child Poverty Among Girls Under 16 Comparison
French Canadians
Chippewa
16.1%
CHILD POVERTY AMONG GIRLS UNDER 16
68.7/ 100
METRIC RATING
162nd/ 347
METRIC RANK
20.6%
CHILD POVERTY AMONG GIRLS UNDER 16
0.0/ 100
METRIC RATING
291st/ 347
METRIC RANK
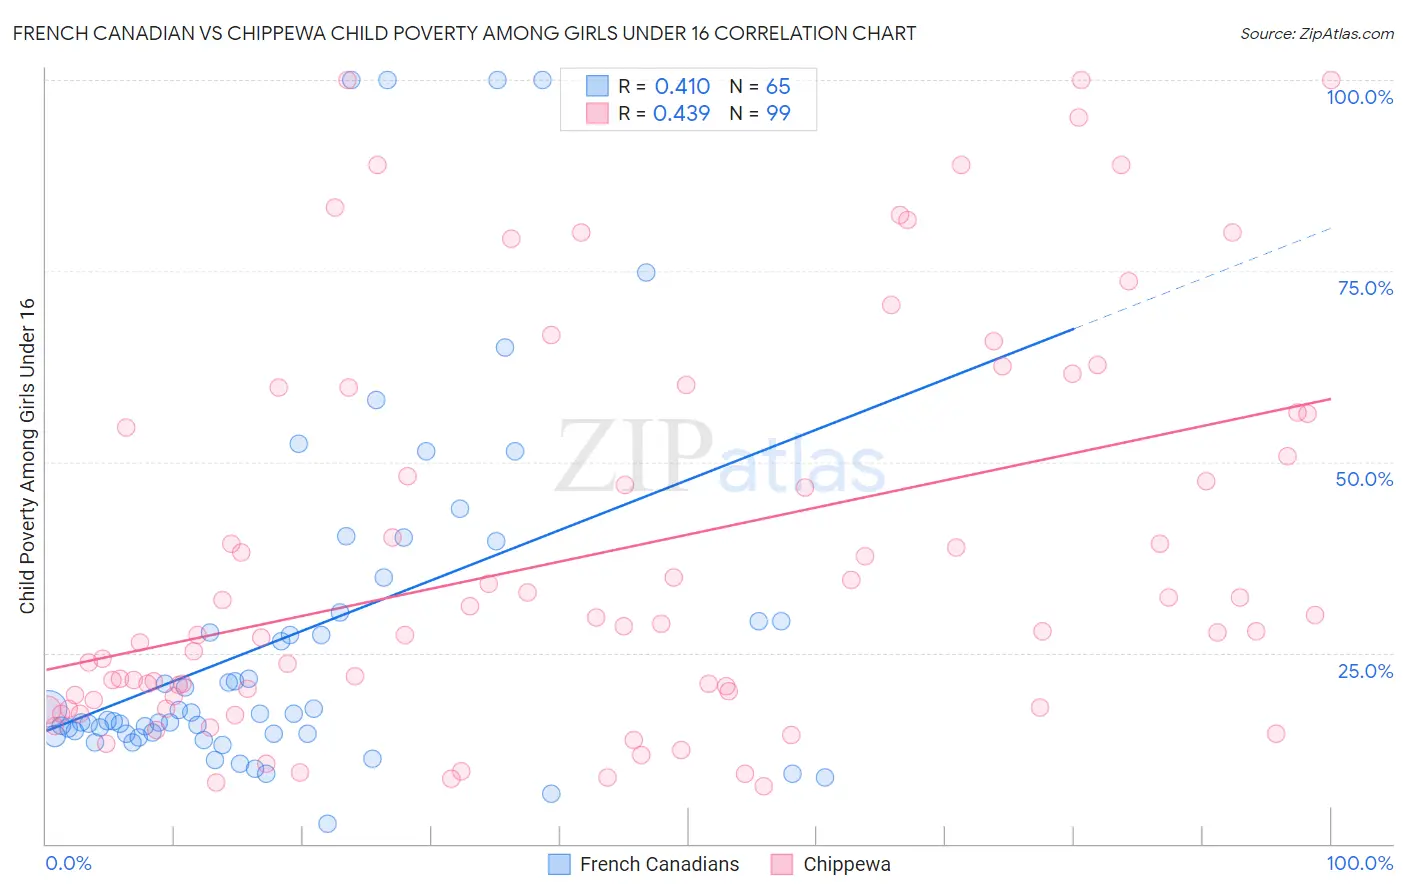
French Canadian vs Chippewa Child Poverty Among Girls Under 16 Correlation Chart
The statistical analysis conducted on geographies consisting of 487,191,826 people shows a moderate positive correlation between the proportion of French Canadians and poverty level among girls under the age of 16 in the United States with a correlation coefficient (R) of 0.410 and weighted average of 16.1%. Similarly, the statistical analysis conducted on geographies consisting of 212,813,465 people shows a moderate positive correlation between the proportion of Chippewa and poverty level among girls under the age of 16 in the United States with a correlation coefficient (R) of 0.439 and weighted average of 20.6%, a difference of 28.2%.
Child Poverty Among Girls Under 16 Correlation Summary
| Measurement | French Canadian | Chippewa |
| Minimum | 2.6% | 7.5% |
| Maximum | 100.0% | 100.0% |
| Range | 97.4% | 92.5% |
| Mean | 27.4% | 37.7% |
| Median | 17.1% | 27.8% |
| Interquartile 25% (IQ1) | 14.4% | 18.9% |
| Interquartile 75% (IQ3) | 29.7% | 56.3% |
| Interquartile Range (IQR) | 15.3% | 37.5% |
| Standard Deviation (Sample) | 23.7% | 25.5% |
| Standard Deviation (Population) | 23.5% | 25.4% |
Similar Demographics by Child Poverty Among Girls Under 16
Demographics Similar to French Canadians by Child Poverty Among Girls Under 16
In terms of child poverty among girls under 16, the demographic groups most similar to French Canadians are Immigrants from Oceania (16.1%, a difference of 0.050%), Immigrants from Colombia (16.1%, a difference of 0.11%), Immigrants from Germany (16.1%, a difference of 0.19%), South American (16.1%, a difference of 0.21%), and Immigrants from Northern Africa (16.0%, a difference of 0.47%).
| Demographics | Rating | Rank | Child Poverty Among Girls Under 16 |
| Syrians | 76.7 /100 | #155 | Good 15.9% |
| Immigrants | Fiji | 76.1 /100 | #156 | Good 15.9% |
| Colombians | 76.1 /100 | #157 | Good 15.9% |
| Guamanians/Chamorros | 75.3 /100 | #158 | Good 15.9% |
| Slovaks | 75.2 /100 | #159 | Good 15.9% |
| French | 72.8 /100 | #160 | Good 16.0% |
| Immigrants | Northern Africa | 72.0 /100 | #161 | Good 16.0% |
| French Canadians | 68.7 /100 | #162 | Good 16.1% |
| Immigrants | Oceania | 68.4 /100 | #163 | Good 16.1% |
| Immigrants | Colombia | 67.8 /100 | #164 | Good 16.1% |
| Immigrants | Germany | 67.3 /100 | #165 | Good 16.1% |
| South Americans | 67.2 /100 | #166 | Good 16.1% |
| Uruguayans | 64.7 /100 | #167 | Good 16.2% |
| Yugoslavians | 64.4 /100 | #168 | Good 16.2% |
| Costa Ricans | 64.2 /100 | #169 | Good 16.2% |
Demographics Similar to Chippewa by Child Poverty Among Girls Under 16
In terms of child poverty among girls under 16, the demographic groups most similar to Chippewa are Immigrants from Latin America (20.6%, a difference of 0.070%), Immigrants from Grenada (20.7%, a difference of 0.11%), Immigrants from Haiti (20.6%, a difference of 0.13%), Immigrants from Belize (20.6%, a difference of 0.20%), and Immigrants from Senegal (20.7%, a difference of 0.22%).
| Demographics | Rating | Rank | Child Poverty Among Girls Under 16 |
| Yaqui | 0.0 /100 | #284 | Tragic 20.3% |
| Immigrants | Cabo Verde | 0.0 /100 | #285 | Tragic 20.3% |
| Iroquois | 0.0 /100 | #286 | Tragic 20.4% |
| Blackfeet | 0.0 /100 | #287 | Tragic 20.5% |
| Haitians | 0.0 /100 | #288 | Tragic 20.5% |
| Immigrants | Belize | 0.0 /100 | #289 | Tragic 20.6% |
| Immigrants | Haiti | 0.0 /100 | #290 | Tragic 20.6% |
| Chippewa | 0.0 /100 | #291 | Tragic 20.6% |
| Immigrants | Latin America | 0.0 /100 | #292 | Tragic 20.6% |
| Immigrants | Grenada | 0.0 /100 | #293 | Tragic 20.7% |
| Immigrants | Senegal | 0.0 /100 | #294 | Tragic 20.7% |
| Immigrants | Caribbean | 0.0 /100 | #295 | Tragic 20.7% |
| Immigrants | West Indies | 0.0 /100 | #296 | Tragic 20.7% |
| Inupiat | 0.0 /100 | #297 | Tragic 20.8% |
| Mexicans | 0.0 /100 | #298 | Tragic 20.9% |