Moroccan vs Immigrants from Iran Male Poverty
COMPARE
Moroccan
Immigrants from Iran
Male Poverty
Male Poverty Comparison
Moroccans
Immigrants from Iran
12.0%
MALE POVERTY
4.2/ 100
METRIC RATING
210th/ 347
METRIC RANK
9.9%
MALE POVERTY
99.1/ 100
METRIC RATING
42nd/ 347
METRIC RANK
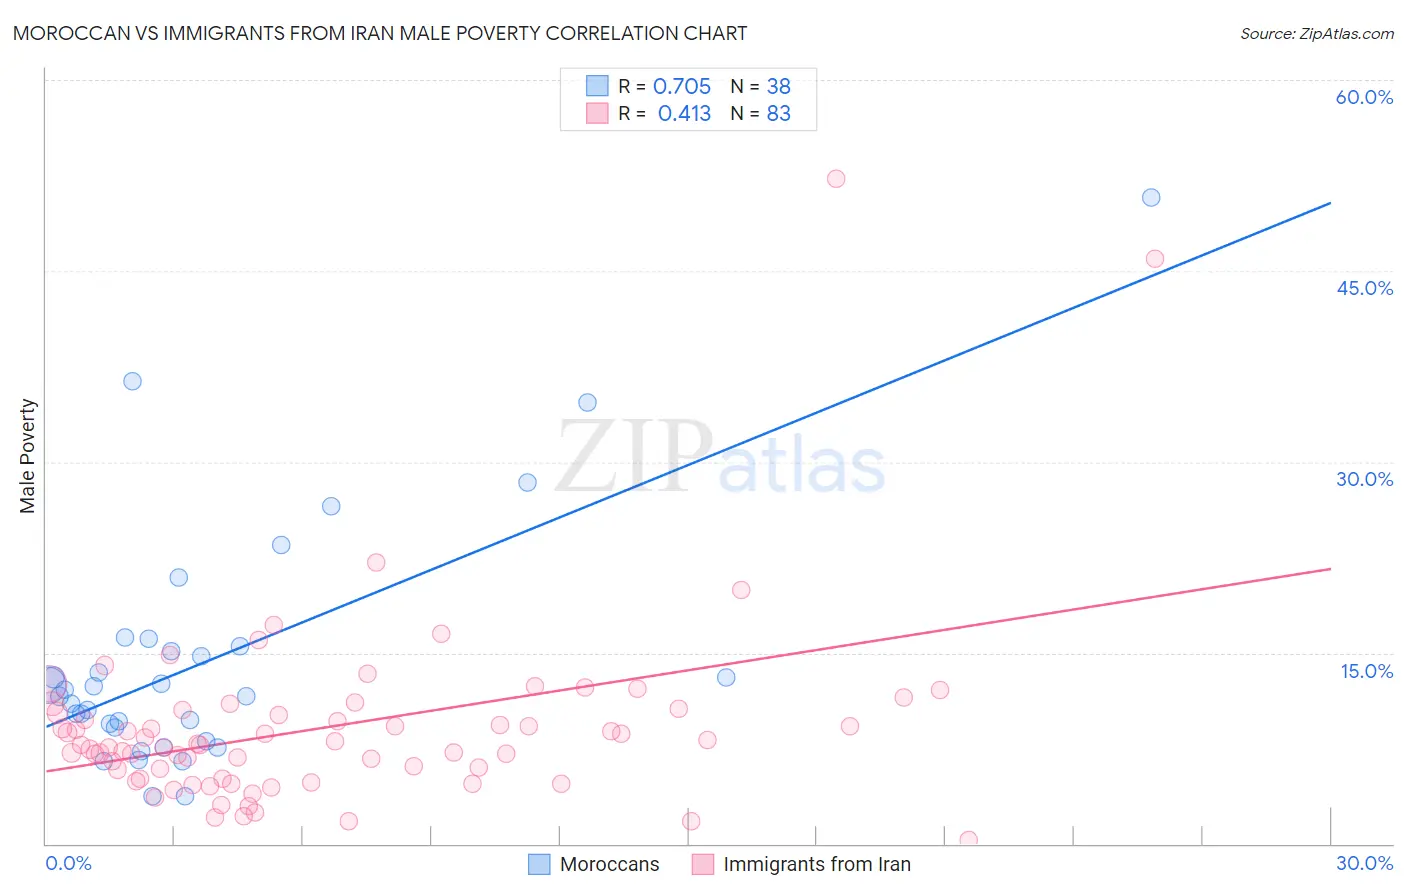
Moroccan vs Immigrants from Iran Male Poverty Correlation Chart
The statistical analysis conducted on geographies consisting of 201,723,684 people shows a strong positive correlation between the proportion of Moroccans and poverty level among males in the United States with a correlation coefficient (R) of 0.705 and weighted average of 12.0%. Similarly, the statistical analysis conducted on geographies consisting of 279,773,882 people shows a moderate positive correlation between the proportion of Immigrants from Iran and poverty level among males in the United States with a correlation coefficient (R) of 0.413 and weighted average of 9.9%, a difference of 21.7%.
Male Poverty Correlation Summary
| Measurement | Moroccan | Immigrants from Iran |
| Minimum | 3.7% | 0.33% |
| Maximum | 50.7% | 52.3% |
| Range | 47.0% | 51.9% |
| Mean | 14.4% | 9.2% |
| Median | 11.8% | 7.8% |
| Interquartile 25% (IQ1) | 9.1% | 5.1% |
| Interquartile 75% (IQ3) | 15.5% | 10.5% |
| Interquartile Range (IQR) | 6.4% | 5.4% |
| Standard Deviation (Sample) | 9.7% | 7.5% |
| Standard Deviation (Population) | 9.6% | 7.4% |
Similar Demographics by Male Poverty
Demographics Similar to Moroccans by Male Poverty
In terms of male poverty, the demographic groups most similar to Moroccans are Immigrants from the Azores (12.0%, a difference of 0.050%), Immigrants from Panama (12.1%, a difference of 0.12%), Immigrants (12.0%, a difference of 0.17%), Malaysian (12.0%, a difference of 0.50%), and Immigrants from Eastern Africa (12.0%, a difference of 0.60%).
| Demographics | Rating | Rank | Male Poverty |
| Immigrants | Western Asia | 9.8 /100 | #203 | Tragic 11.8% |
| Immigrants | Uganda | 8.5 /100 | #204 | Tragic 11.8% |
| Panamanians | 6.2 /100 | #205 | Tragic 11.9% |
| Immigrants | Eastern Africa | 5.4 /100 | #206 | Tragic 12.0% |
| Malaysians | 5.2 /100 | #207 | Tragic 12.0% |
| Immigrants | Immigrants | 4.5 /100 | #208 | Tragic 12.0% |
| Immigrants | Azores | 4.3 /100 | #209 | Tragic 12.0% |
| Moroccans | 4.2 /100 | #210 | Tragic 12.0% |
| Immigrants | Panama | 4.0 /100 | #211 | Tragic 12.1% |
| Americans | 3.2 /100 | #212 | Tragic 12.1% |
| Immigrants | Nonimmigrants | 3.1 /100 | #213 | Tragic 12.1% |
| Japanese | 2.7 /100 | #214 | Tragic 12.2% |
| Immigrants | Uzbekistan | 2.6 /100 | #215 | Tragic 12.2% |
| Immigrants | Cambodia | 2.5 /100 | #216 | Tragic 12.2% |
| Immigrants | Thailand | 2.5 /100 | #217 | Tragic 12.2% |
Demographics Similar to Immigrants from Iran by Male Poverty
In terms of male poverty, the demographic groups most similar to Immigrants from Iran are Korean (9.9%, a difference of 0.24%), Immigrants from Moldova (9.9%, a difference of 0.26%), Cypriot (9.9%, a difference of 0.34%), Immigrants from Pakistan (9.9%, a difference of 0.42%), and Russian (9.9%, a difference of 0.42%).
| Demographics | Rating | Rank | Male Poverty |
| Iranians | 99.4 /100 | #35 | Exceptional 9.8% |
| Czechs | 99.4 /100 | #36 | Exceptional 9.8% |
| Immigrants | Greece | 99.3 /100 | #37 | Exceptional 9.8% |
| Immigrants | Pakistan | 99.2 /100 | #38 | Exceptional 9.9% |
| Russians | 99.2 /100 | #39 | Exceptional 9.9% |
| Cypriots | 99.2 /100 | #40 | Exceptional 9.9% |
| Koreans | 99.2 /100 | #41 | Exceptional 9.9% |
| Immigrants | Iran | 99.1 /100 | #42 | Exceptional 9.9% |
| Immigrants | Moldova | 99.0 /100 | #43 | Exceptional 9.9% |
| Immigrants | Romania | 98.9 /100 | #44 | Exceptional 9.9% |
| Immigrants | Serbia | 98.9 /100 | #45 | Exceptional 10.0% |
| Turks | 98.9 /100 | #46 | Exceptional 10.0% |
| Immigrants | Singapore | 98.8 /100 | #47 | Exceptional 10.0% |
| Immigrants | Japan | 98.8 /100 | #48 | Exceptional 10.0% |
| Slovenes | 98.8 /100 | #49 | Exceptional 10.0% |