Moroccan vs Austrian Male Poverty
COMPARE
Moroccan
Austrian
Male Poverty
Male Poverty Comparison
Moroccans
Austrians
12.0%
MALE POVERTY
4.2/ 100
METRIC RATING
210th/ 347
METRIC RANK
10.1%
MALE POVERTY
97.8/ 100
METRIC RATING
61st/ 347
METRIC RANK
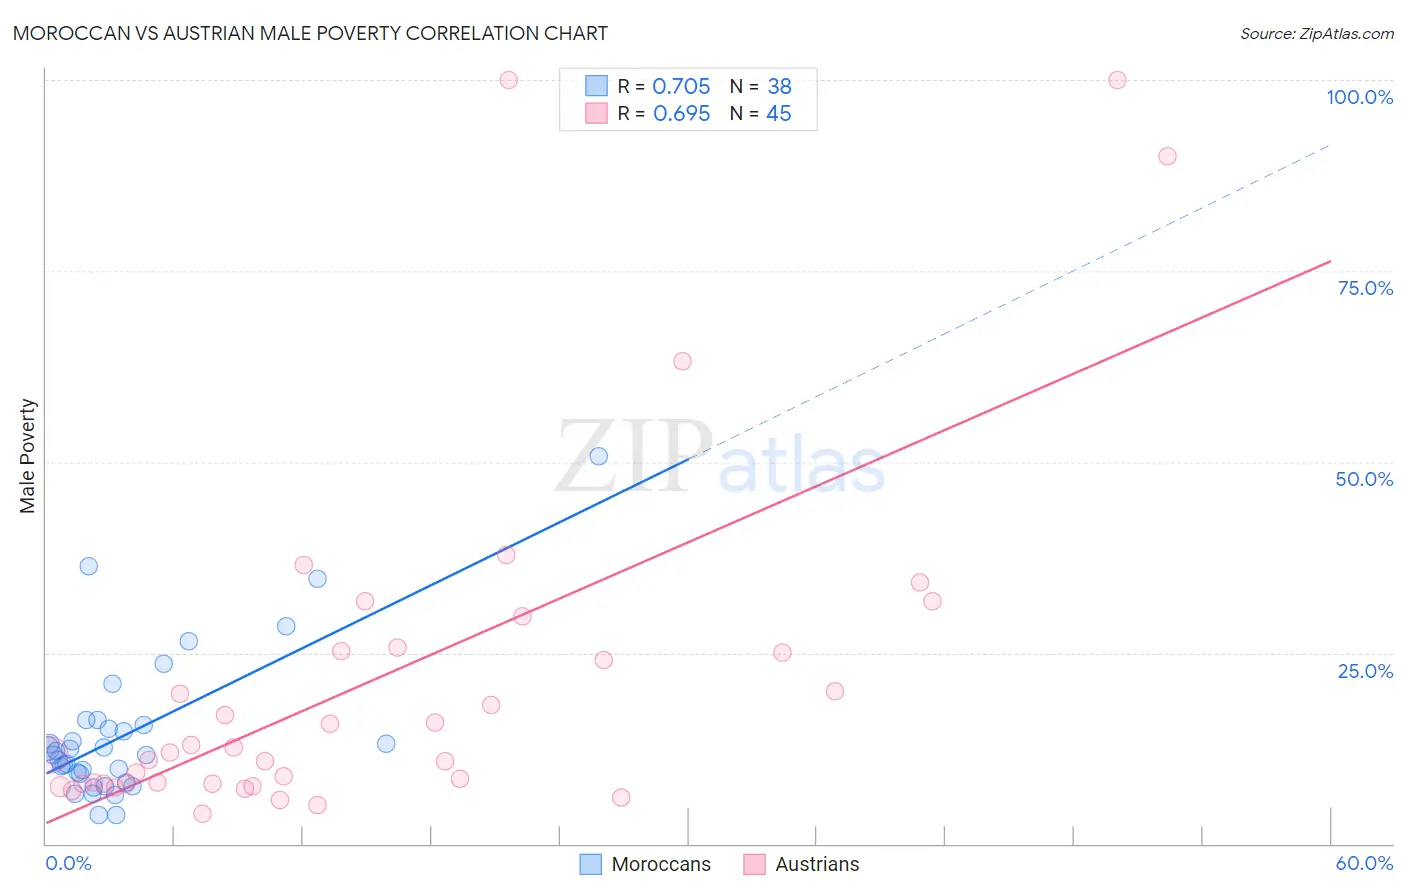
Moroccan vs Austrian Male Poverty Correlation Chart
The statistical analysis conducted on geographies consisting of 201,723,684 people shows a strong positive correlation between the proportion of Moroccans and poverty level among males in the United States with a correlation coefficient (R) of 0.705 and weighted average of 12.0%. Similarly, the statistical analysis conducted on geographies consisting of 451,474,043 people shows a significant positive correlation between the proportion of Austrians and poverty level among males in the United States with a correlation coefficient (R) of 0.695 and weighted average of 10.1%, a difference of 18.7%.
Male Poverty Correlation Summary
| Measurement | Moroccan | Austrian |
| Minimum | 3.7% | 4.0% |
| Maximum | 50.7% | 100.0% |
| Range | 47.0% | 96.0% |
| Mean | 14.4% | 21.7% |
| Median | 11.8% | 11.9% |
| Interquartile 25% (IQ1) | 9.1% | 7.9% |
| Interquartile 75% (IQ3) | 15.5% | 25.5% |
| Interquartile Range (IQR) | 6.4% | 17.6% |
| Standard Deviation (Sample) | 9.7% | 23.4% |
| Standard Deviation (Population) | 9.6% | 23.2% |
Similar Demographics by Male Poverty
Demographics Similar to Moroccans by Male Poverty
In terms of male poverty, the demographic groups most similar to Moroccans are Immigrants from the Azores (12.0%, a difference of 0.050%), Immigrants from Panama (12.1%, a difference of 0.12%), Immigrants (12.0%, a difference of 0.17%), Malaysian (12.0%, a difference of 0.50%), and Immigrants from Eastern Africa (12.0%, a difference of 0.60%).
| Demographics | Rating | Rank | Male Poverty |
| Immigrants | Western Asia | 9.8 /100 | #203 | Tragic 11.8% |
| Immigrants | Uganda | 8.5 /100 | #204 | Tragic 11.8% |
| Panamanians | 6.2 /100 | #205 | Tragic 11.9% |
| Immigrants | Eastern Africa | 5.4 /100 | #206 | Tragic 12.0% |
| Malaysians | 5.2 /100 | #207 | Tragic 12.0% |
| Immigrants | Immigrants | 4.5 /100 | #208 | Tragic 12.0% |
| Immigrants | Azores | 4.3 /100 | #209 | Tragic 12.0% |
| Moroccans | 4.2 /100 | #210 | Tragic 12.0% |
| Immigrants | Panama | 4.0 /100 | #211 | Tragic 12.1% |
| Americans | 3.2 /100 | #212 | Tragic 12.1% |
| Immigrants | Nonimmigrants | 3.1 /100 | #213 | Tragic 12.1% |
| Japanese | 2.7 /100 | #214 | Tragic 12.2% |
| Immigrants | Uzbekistan | 2.6 /100 | #215 | Tragic 12.2% |
| Immigrants | Cambodia | 2.5 /100 | #216 | Tragic 12.2% |
| Immigrants | Thailand | 2.5 /100 | #217 | Tragic 12.2% |
Demographics Similar to Austrians by Male Poverty
In terms of male poverty, the demographic groups most similar to Austrians are Ukrainian (10.1%, a difference of 0.020%), Immigrants from Italy (10.2%, a difference of 0.090%), Immigrants from Europe (10.1%, a difference of 0.11%), Slovak (10.2%, a difference of 0.13%), and Scandinavian (10.1%, a difference of 0.24%).
| Demographics | Rating | Rank | Male Poverty |
| Immigrants | Austria | 98.5 /100 | #54 | Exceptional 10.0% |
| Germans | 98.3 /100 | #55 | Exceptional 10.1% |
| Immigrants | Bulgaria | 98.2 /100 | #56 | Exceptional 10.1% |
| Estonians | 98.1 /100 | #57 | Exceptional 10.1% |
| Scandinavians | 98.0 /100 | #58 | Exceptional 10.1% |
| Immigrants | Europe | 97.9 /100 | #59 | Exceptional 10.1% |
| Ukrainians | 97.9 /100 | #60 | Exceptional 10.1% |
| Austrians | 97.8 /100 | #61 | Exceptional 10.1% |
| Immigrants | Italy | 97.8 /100 | #62 | Exceptional 10.2% |
| Slovaks | 97.7 /100 | #63 | Exceptional 10.2% |
| Swiss | 97.5 /100 | #64 | Exceptional 10.2% |
| Zimbabweans | 97.5 /100 | #65 | Exceptional 10.2% |
| Serbians | 97.5 /100 | #66 | Exceptional 10.2% |
| Immigrants | Netherlands | 97.3 /100 | #67 | Exceptional 10.2% |
| Immigrants | Sri Lanka | 97.2 /100 | #68 | Exceptional 10.2% |