Moroccan vs Immigrants from Lithuania Per Capita Income
COMPARE
Moroccan
Immigrants from Lithuania
Per Capita Income
Per Capita Income Comparison
Moroccans
Immigrants from Lithuania
$45,854
PER CAPITA INCOME
92.1/ 100
METRIC RATING
122nd/ 347
METRIC RANK
$51,361
PER CAPITA INCOME
100.0/ 100
METRIC RATING
43rd/ 347
METRIC RANK
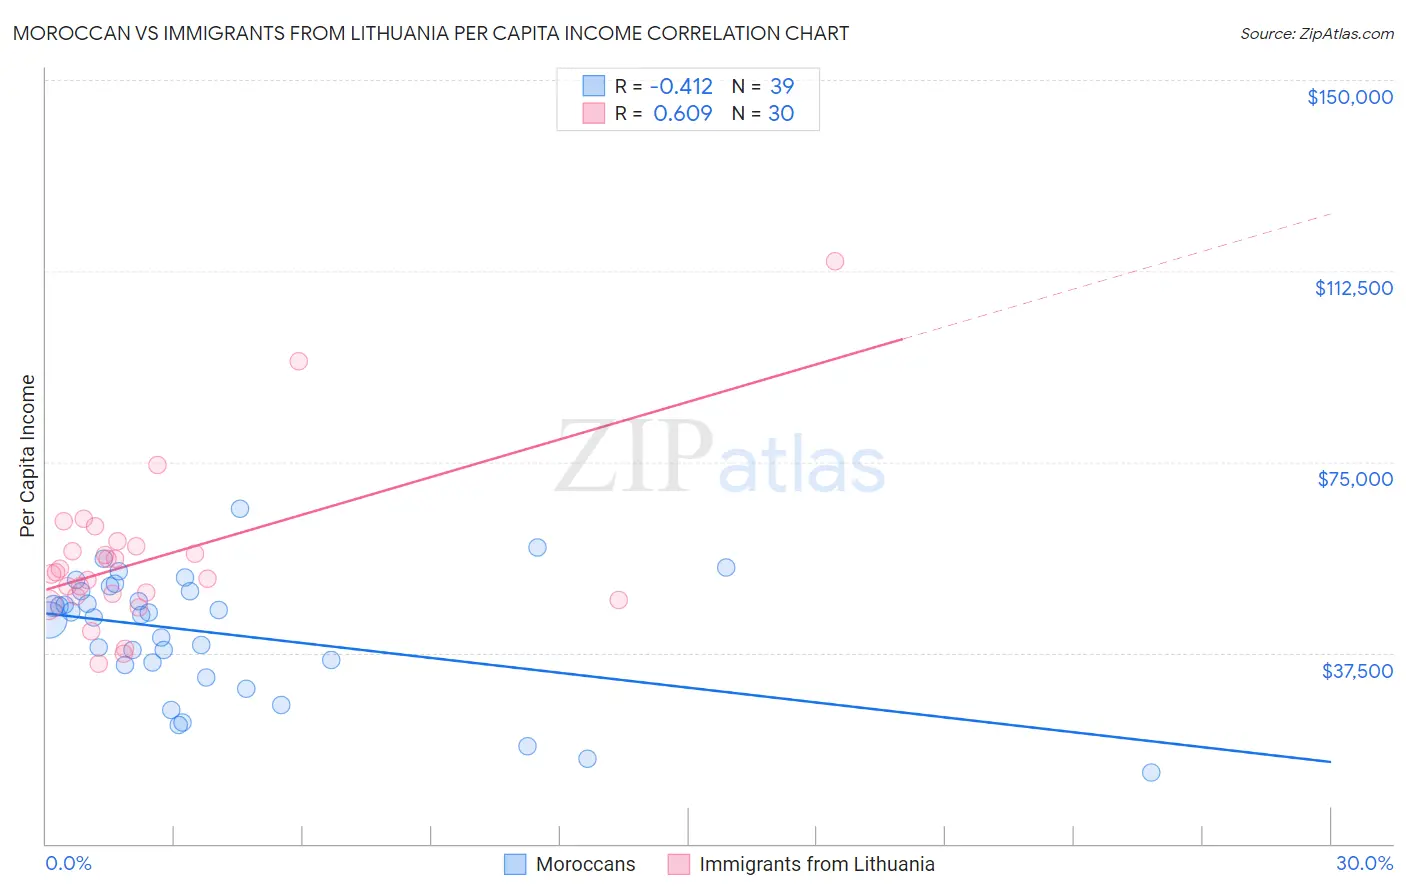
Moroccan vs Immigrants from Lithuania Per Capita Income Correlation Chart
The statistical analysis conducted on geographies consisting of 201,819,214 people shows a moderate negative correlation between the proportion of Moroccans and per capita income in the United States with a correlation coefficient (R) of -0.412 and weighted average of $45,854. Similarly, the statistical analysis conducted on geographies consisting of 117,724,932 people shows a significant positive correlation between the proportion of Immigrants from Lithuania and per capita income in the United States with a correlation coefficient (R) of 0.609 and weighted average of $51,361, a difference of 12.0%.
Per Capita Income Correlation Summary
| Measurement | Moroccan | Immigrants from Lithuania |
| Minimum | $14,047 | $35,413 |
| Maximum | $65,725 | $114,327 |
| Range | $51,678 | $78,914 |
| Mean | $41,336 | $56,005 |
| Median | $44,873 | $53,196 |
| Interquartile 25% (IQ1) | $35,130 | $48,580 |
| Interquartile 75% (IQ3) | $49,634 | $58,433 |
| Interquartile Range (IQR) | $14,504 | $9,853 |
| Standard Deviation (Sample) | $11,952 | $15,760 |
| Standard Deviation (Population) | $11,797 | $15,495 |
Similar Demographics by Per Capita Income
Demographics Similar to Moroccans by Per Capita Income
In terms of per capita income, the demographic groups most similar to Moroccans are Canadian ($45,858, a difference of 0.010%), Lebanese ($45,840, a difference of 0.030%), European ($45,836, a difference of 0.040%), Zimbabwean ($45,804, a difference of 0.11%), and Palestinian ($45,790, a difference of 0.14%).
| Demographics | Rating | Rank | Per Capita Income |
| Immigrants | Chile | 94.6 /100 | #115 | Exceptional $46,213 |
| Poles | 94.1 /100 | #116 | Exceptional $46,123 |
| Chinese | 93.9 /100 | #117 | Exceptional $46,098 |
| Immigrants | Saudi Arabia | 93.3 /100 | #118 | Exceptional $46,008 |
| Immigrants | Poland | 93.1 /100 | #119 | Exceptional $45,979 |
| Immigrants | Ethiopia | 92.7 /100 | #120 | Exceptional $45,923 |
| Canadians | 92.2 /100 | #121 | Exceptional $45,858 |
| Moroccans | 92.1 /100 | #122 | Exceptional $45,854 |
| Lebanese | 92.0 /100 | #123 | Exceptional $45,840 |
| Europeans | 92.0 /100 | #124 | Exceptional $45,836 |
| Zimbabweans | 91.7 /100 | #125 | Exceptional $45,804 |
| Palestinians | 91.6 /100 | #126 | Exceptional $45,790 |
| Immigrants | Germany | 91.3 /100 | #127 | Exceptional $45,751 |
| Swedes | 91.3 /100 | #128 | Exceptional $45,750 |
| Luxembourgers | 90.4 /100 | #129 | Exceptional $45,663 |
Demographics Similar to Immigrants from Lithuania by Per Capita Income
In terms of per capita income, the demographic groups most similar to Immigrants from Lithuania are Immigrants from Turkey ($51,368, a difference of 0.010%), Immigrants from South Africa ($51,465, a difference of 0.20%), Immigrants from Korea ($51,671, a difference of 0.60%), Cambodian ($51,731, a difference of 0.72%), and Immigrants from Czechoslovakia ($51,770, a difference of 0.80%).
| Demographics | Rating | Rank | Per Capita Income |
| Immigrants | Greece | 100.0 /100 | #36 | Exceptional $51,891 |
| Estonians | 100.0 /100 | #37 | Exceptional $51,875 |
| Immigrants | Czechoslovakia | 100.0 /100 | #38 | Exceptional $51,770 |
| Cambodians | 100.0 /100 | #39 | Exceptional $51,731 |
| Immigrants | Korea | 100.0 /100 | #40 | Exceptional $51,671 |
| Immigrants | South Africa | 100.0 /100 | #41 | Exceptional $51,465 |
| Immigrants | Turkey | 100.0 /100 | #42 | Exceptional $51,368 |
| Immigrants | Lithuania | 100.0 /100 | #43 | Exceptional $51,361 |
| Immigrants | Europe | 100.0 /100 | #44 | Exceptional $50,950 |
| Immigrants | Spain | 100.0 /100 | #45 | Exceptional $50,933 |
| Immigrants | Latvia | 100.0 /100 | #46 | Exceptional $50,914 |
| Bulgarians | 100.0 /100 | #47 | Exceptional $50,906 |
| Immigrants | Serbia | 100.0 /100 | #48 | Exceptional $50,810 |
| New Zealanders | 100.0 /100 | #49 | Exceptional $50,575 |
| Immigrants | Sri Lanka | 100.0 /100 | #50 | Exceptional $50,555 |