Moroccan vs British Single Male Poverty
COMPARE
Moroccan
British
Single Male Poverty
Single Male Poverty Comparison
Moroccans
British
12.9%
SINGLE MALE POVERTY
36.8/ 100
METRIC RATING
182nd/ 347
METRIC RANK
13.3%
SINGLE MALE POVERTY
4.0/ 100
METRIC RATING
233rd/ 347
METRIC RANK
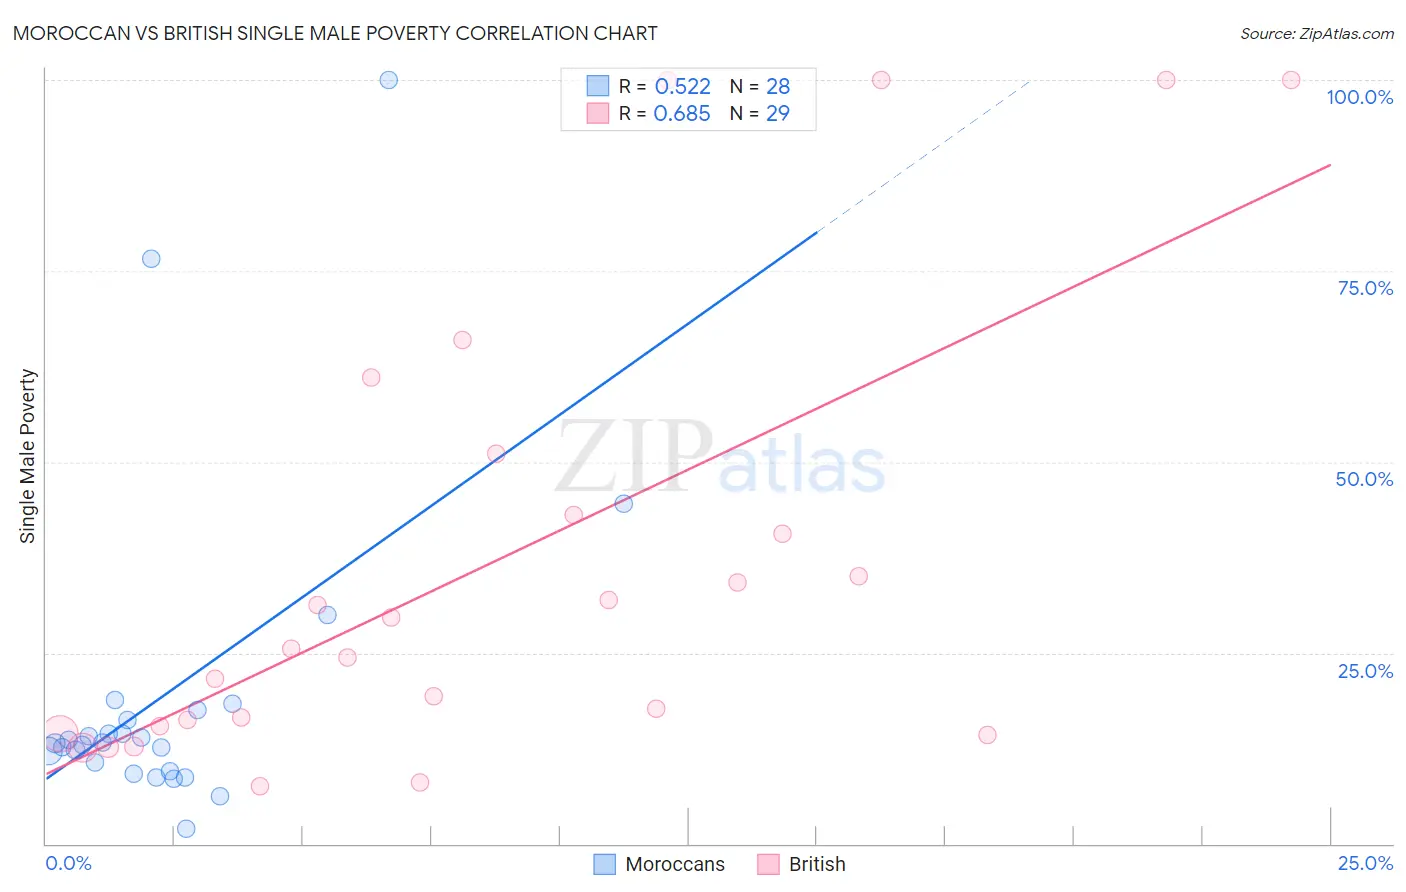
Moroccan vs British Single Male Poverty Correlation Chart
The statistical analysis conducted on geographies consisting of 188,123,639 people shows a substantial positive correlation between the proportion of Moroccans and poverty level among single males in the United States with a correlation coefficient (R) of 0.522 and weighted average of 12.9%. Similarly, the statistical analysis conducted on geographies consisting of 447,626,484 people shows a significant positive correlation between the proportion of British and poverty level among single males in the United States with a correlation coefficient (R) of 0.685 and weighted average of 13.3%, a difference of 3.5%.
Single Male Poverty Correlation Summary
| Measurement | Moroccan | British |
| Minimum | 1.9% | 7.6% |
| Maximum | 100.0% | 100.0% |
| Range | 98.1% | 92.4% |
| Mean | 19.4% | 36.6% |
| Median | 13.2% | 25.5% |
| Interquartile 25% (IQ1) | 10.0% | 14.9% |
| Interquartile 75% (IQ3) | 16.9% | 47.1% |
| Interquartile Range (IQR) | 6.9% | 32.2% |
| Standard Deviation (Sample) | 21.2% | 29.7% |
| Standard Deviation (Population) | 20.8% | 29.2% |
Similar Demographics by Single Male Poverty
Demographics Similar to Moroccans by Single Male Poverty
In terms of single male poverty, the demographic groups most similar to Moroccans are Panamanian (12.9%, a difference of 0.040%), Immigrants from North America (12.9%, a difference of 0.050%), Immigrants from West Indies (12.9%, a difference of 0.22%), Israeli (12.9%, a difference of 0.23%), and Immigrants from Trinidad and Tobago (12.9%, a difference of 0.25%).
| Demographics | Rating | Rank | Single Male Poverty |
| Croatians | 48.9 /100 | #175 | Average 12.8% |
| Syrians | 48.4 /100 | #176 | Average 12.8% |
| Immigrants | Canada | 44.8 /100 | #177 | Average 12.8% |
| Immigrants | Switzerland | 43.1 /100 | #178 | Average 12.8% |
| Israelis | 41.0 /100 | #179 | Average 12.9% |
| Immigrants | North America | 37.7 /100 | #180 | Fair 12.9% |
| Panamanians | 37.6 /100 | #181 | Fair 12.9% |
| Moroccans | 36.8 /100 | #182 | Fair 12.9% |
| Immigrants | West Indies | 33.0 /100 | #183 | Fair 12.9% |
| Immigrants | Trinidad and Tobago | 32.5 /100 | #184 | Fair 12.9% |
| Norwegians | 32.0 /100 | #185 | Fair 12.9% |
| Nigerians | 31.9 /100 | #186 | Fair 12.9% |
| Immigrants | Kuwait | 31.9 /100 | #187 | Fair 12.9% |
| Macedonians | 31.5 /100 | #188 | Fair 12.9% |
| Portuguese | 30.2 /100 | #189 | Fair 12.9% |
Demographics Similar to British by Single Male Poverty
In terms of single male poverty, the demographic groups most similar to British are Canadian (13.3%, a difference of 0.0%), Bangladeshi (13.3%, a difference of 0.10%), Luxembourger (13.4%, a difference of 0.16%), British West Indian (13.4%, a difference of 0.21%), and Immigrants from Caribbean (13.3%, a difference of 0.29%).
| Demographics | Rating | Rank | Single Male Poverty |
| Jamaicans | 7.7 /100 | #226 | Tragic 13.2% |
| Haitians | 7.0 /100 | #227 | Tragic 13.2% |
| Lebanese | 6.6 /100 | #228 | Tragic 13.2% |
| Europeans | 6.2 /100 | #229 | Tragic 13.3% |
| Ghanaians | 6.1 /100 | #230 | Tragic 13.3% |
| Slavs | 5.3 /100 | #231 | Tragic 13.3% |
| Immigrants | Caribbean | 5.0 /100 | #232 | Tragic 13.3% |
| British | 4.0 /100 | #233 | Tragic 13.3% |
| Canadians | 4.0 /100 | #234 | Tragic 13.3% |
| Bangladeshis | 3.7 /100 | #235 | Tragic 13.3% |
| Luxembourgers | 3.6 /100 | #236 | Tragic 13.4% |
| British West Indians | 3.4 /100 | #237 | Tragic 13.4% |
| Immigrants | Ghana | 3.2 /100 | #238 | Tragic 13.4% |
| Czechoslovakians | 3.0 /100 | #239 | Tragic 13.4% |
| Belizeans | 2.3 /100 | #240 | Tragic 13.4% |