Moroccan vs Immigrants from Kenya Single Male Poverty

COMPARE

Moroccan
Race
Ancestry
AfghanAfricanAlaska NativeAlaskan AthabascanAlbanianAleutAlsatianAmericanApacheArabArapahoArgentineanArmenianAssyrian/Chaldean/SyriacAustralianAustrianBahamianBangladeshiBarbadianBasqueBelgianBelizeanBermudanBhutaneseBlackfeetBolivianBrazilianBritishBritish West IndianBulgarianBurmeseCajunCambodianCanadianCape VerdeanCarpatho RusynCelticCentral AmericanCentral American IndianCherokeeCheyenneChickasawChileanChineseChippewaChoctawColombianColvilleComancheCosta RicanCreeCreekCroatianCrowCubanCypriotCzechCzechoslovakianDanishDelawareDominicanDutchDutch West IndianEastern EuropeanEcuadorianEgyptianEnglishEstonianEthiopianEuropeanFijianFilipinoFinnishFrenchFrench American IndianFrench CanadianGermanGerman RussianGhanaianGreekGuamanian/ChamorroGuatemalanGuyaneseHaitianHmongHonduranHopiHoumaHungarianIcelanderIndian (Asian)IndonesianInupiatIranianIraqiIrishIroquoisIsraeliItalianJamaicanJapaneseJordanianKenyanKiowaKoreanLaotianLatvianLebaneseLiberianLithuanianLumbeeLuxembourgerMacedonianMalaysianMalteseMarshalleseMenomineeMexicanMexican American IndianMongolianMoroccanNative HawaiianNavajoNepaleseNew ZealanderNicaraguanNigerianNorthern EuropeanNorwegianOkinawanOsageOttawaPaiutePakistaniPalestinianPanamanianParaguayanPennsylvania GermanPeruvianPimaPolishPortuguesePotawatomiPuebloPuerto RicanPuget Sound SalishRomanianRussianSalvadoranSamoanScandinavianScotch-IrishScottishSeminoleSenegaleseSerbianShoshoneSierra LeoneanSiouxSlavicSlovakSloveneSomaliSouth AfricanSouth AmericanSouth American IndianSoviet UnionSpaniardSpanishSpanish AmericanSpanish American IndianSri LankanSubsaharan AfricanSudaneseSwedishSwissSyrianTaiwaneseThaiTlingit-HaidaTohono O'OdhamTonganTrinidadian and TobagonianTsimshianTurkishU.S. Virgin IslanderUgandanUkrainianUruguayanUteVenezuelanVietnameseWelshWest IndianYakamaYaquiYugoslavianYumanYup'ikZimbabwean
Immigration
NonimmigrantsImmigrantsAfghanistanAfricaAlbaniaArgentinaArmeniaAsiaAustraliaAustriaBahamasBangladeshBarbadosBelarusBelgiumBelizeBoliviaBosnia and HerzegovinaBrazilBulgariaBurma/MyanmarCabo VerdeCambodiaCameroonCanadaCaribbeanCentral AmericaChileChinaColombiaCongoCosta RicaCroatiaCubaCzechoslovakiaDenmarkDominicaDominican RepublicEastern AfricaEastern AsiaEastern EuropeEcuadorEgyptEl SalvadorEnglandEritreaEthiopiaEuropeFijiFranceGermanyGhanaGreeceGrenadaGuatemalaGuyanaHaitiHondurasHong KongHungaryIndiaIndonesiaIranIraqIrelandIsraelItalyJamaicaJapanJordanKazakhstanKoreaKuwaitLaosLatin AmericaLatviaLebanonLiberiaLithuaniaMalaysiaMexicoMicronesiaMiddle AfricaMoldovaMoroccoNepalNetherlandsNicaraguaNigeriaNorth AmericaNorth MacedoniaNorthern AfricaNorthern EuropeNorwayOceaniaPakistanPanamaPeruPhilippinesPolandPortugalRomaniaRussiaSaudi ArabiaScotlandSenegalSerbiaSierra LeoneSingaporeSomaliaSouth AfricaSouth AmericaSouth Central AsiaSouth Eastern AsiaSouthern EuropeSpainSri LankaSt. Vincent and the GrenadinesSudanSwedenSwitzerlandSyriaTaiwanThailandTrinidad and TobagoTurkeyUgandaUkraineUruguayUzbekistanVenezuelaVietnamWest IndiesWestern AfricaWestern AsiaWestern EuropeYemenZaireZimbabweAzores
Immigrants from Kenya
Race
Ancestry
AfghanAfricanAlaska NativeAlaskan AthabascanAlbanianAleutAlsatianAmericanApacheArabArapahoArgentineanArmenianAssyrian/Chaldean/SyriacAustralianAustrianBahamianBangladeshiBarbadianBasqueBelgianBelizeanBermudanBhutaneseBlackfeetBolivianBrazilianBritishBritish West IndianBulgarianBurmeseCajunCambodianCanadianCape VerdeanCarpatho RusynCelticCentral AmericanCentral American IndianCherokeeCheyenneChickasawChileanChineseChippewaChoctawColombianColvilleComancheCosta RicanCreeCreekCroatianCrowCubanCypriotCzechCzechoslovakianDanishDelawareDominicanDutchDutch West IndianEastern EuropeanEcuadorianEgyptianEnglishEstonianEthiopianEuropeanFijianFilipinoFinnishFrenchFrench American IndianFrench CanadianGermanGerman RussianGhanaianGreekGuamanian/ChamorroGuatemalanGuyaneseHaitianHmongHonduranHopiHoumaHungarianIcelanderIndian (Asian)IndonesianInupiatIranianIraqiIrishIroquoisIsraeliItalianJamaicanJapaneseJordanianKenyanKiowaKoreanLaotianLatvianLebaneseLiberianLithuanianLumbeeLuxembourgerMacedonianMalaysianMalteseMarshalleseMenomineeMexicanMexican American IndianMongolianNative HawaiianNavajoNepaleseNew ZealanderNicaraguanNigerianNorthern EuropeanNorwegianOkinawanOsageOttawaPaiutePakistaniPalestinianPanamanianParaguayanPennsylvania GermanPeruvianPimaPolishPortuguesePotawatomiPuebloPuerto RicanPuget Sound SalishRomanianRussianSalvadoranSamoanScandinavianScotch-IrishScottishSeminoleSenegaleseSerbianShoshoneSierra LeoneanSiouxSlavicSlovakSloveneSomaliSouth AfricanSouth AmericanSouth American IndianSoviet UnionSpaniardSpanishSpanish AmericanSpanish American IndianSri LankanSubsaharan AfricanSudaneseSwedishSwissSyrianTaiwaneseThaiTlingit-HaidaTohono O'OdhamTonganTrinidadian and TobagonianTsimshianTurkishU.S. Virgin IslanderUgandanUkrainianUruguayanUteVenezuelanVietnameseWelshWest IndianYakamaYaquiYugoslavianYumanYup'ikZimbabwean
Immigration
NonimmigrantsImmigrantsAfghanistanAfricaAlbaniaArgentinaArmeniaAsiaAustraliaAustriaBahamasBangladeshBarbadosBelarusBelgiumBelizeBoliviaBosnia and HerzegovinaBrazilBulgariaBurma/MyanmarCabo VerdeCambodiaCameroonCanadaCaribbeanCentral AmericaChileChinaColombiaCongoCosta RicaCroatiaCubaCzechoslovakiaDenmarkDominicaDominican RepublicEastern AfricaEastern AsiaEastern EuropeEcuadorEgyptEl SalvadorEnglandEritreaEthiopiaEuropeFijiFranceGermanyGhanaGreeceGrenadaGuatemalaGuyanaHaitiHondurasHong KongHungaryIndiaIndonesiaIranIraqIrelandIsraelItalyJamaicaJapanJordanKazakhstanKenyaKoreaKuwaitLaosLatin AmericaLatviaLebanonLiberiaLithuaniaMalaysiaMexicoMicronesiaMiddle AfricaMoldovaMoroccoNepalNetherlandsNicaraguaNigeriaNorth AmericaNorth MacedoniaNorthern AfricaNorthern EuropeNorwayOceaniaPakistanPanamaPeruPhilippinesPolandPortugalRomaniaRussiaSaudi ArabiaScotlandSenegalSerbiaSierra LeoneSingaporeSomaliaSouth AfricaSouth AmericaSouth Central AsiaSouth Eastern AsiaSouthern EuropeSpainSri LankaSt. Vincent and the GrenadinesSudanSwedenSwitzerlandSyriaTaiwanThailandTrinidad and TobagoTurkeyUgandaUkraineUruguayUzbekistanVenezuelaVietnamWest IndiesWestern AfricaWestern AsiaWestern EuropeYemenZaireZimbabweAzores
Single Male Poverty
Income
Poverty
Unemployment
Labor Participation
Family Structure
Vehicle Availability
Education Level
Disability

Single Male Poverty Comparison

Moroccans

Immigrants from Kenya

Fair
Excellent
12.9%
SINGLE MALE POVERTY
36.8/ 100
METRIC RATING
182nd/ 347
METRIC RANK
12.5%
SINGLE MALE POVERTY
87.6/ 100
METRIC RATING
123rd/ 347
METRIC RANK

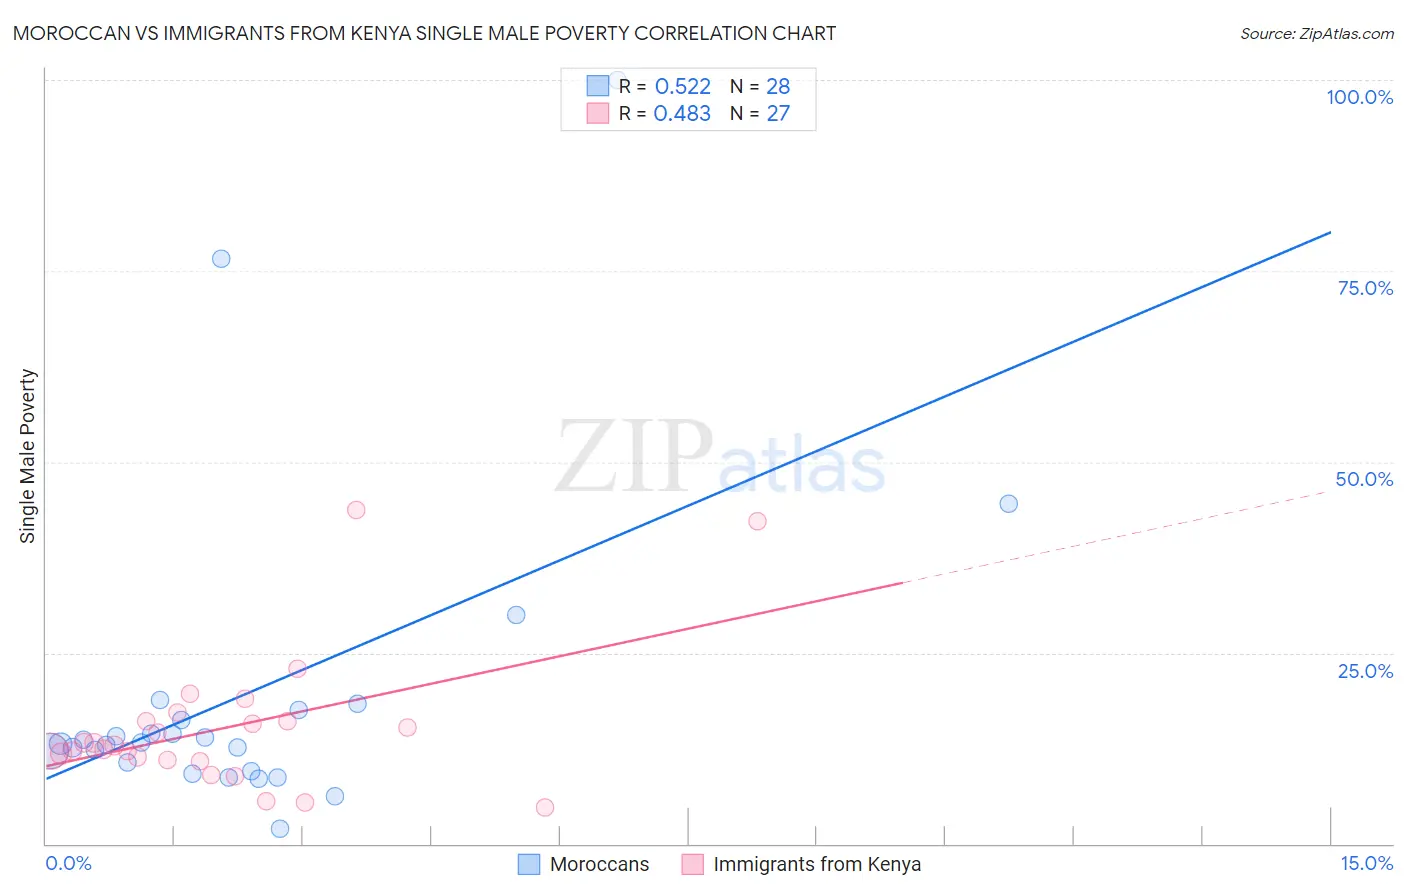
Moroccan vs Immigrants from Kenya Single Male Poverty Correlation Chart

The statistical analysis conducted on geographies consisting of 188,123,639 people shows a substantial positive correlation between the proportion of Moroccans and poverty level among single males in the United States with a correlation coefficient (R) of 0.522 and weighted average of 12.9%. Similarly, the statistical analysis conducted on geographies consisting of 201,857,660 people shows a moderate positive correlation between the proportion of Immigrants from Kenya and poverty level among single males in the United States with a correlation coefficient (R) of 0.483 and weighted average of 12.5%, a difference of 3.4%.
Moroccan vs Immigrants from Kenya Single Male Poverty

Single Male Poverty Correlation Summary

MeasurementMoroccanImmigrants from Kenya
Minimum1.9%4.8%
Maximum100.0%43.7%
Range98.1%38.9%
Mean19.4%15.1%
Median13.2%12.9%
Interquartile 25% (IQ1)10.0%10.9%
Interquartile 75% (IQ3)16.9%16.1%
Interquartile Range (IQR)6.9%5.2%
Standard Deviation (Sample)21.2%9.1%
Standard Deviation (Population)20.8%8.9%

Similar Demographics by Single Male Poverty

Demographics Similar to Moroccans by Single Male Poverty

In terms of single male poverty, the demographic groups most similar to Moroccans are Panamanian (12.9%, a difference of 0.040%), Immigrants from North America (12.9%, a difference of 0.050%), Immigrants from West Indies (12.9%, a difference of 0.22%), Israeli (12.9%, a difference of 0.23%), and Immigrants from Trinidad and Tobago (12.9%, a difference of 0.25%).
DemographicsRating | RankSingle Male Poverty
Croatians
48.9
/100
|
#175
Average
12.8%
Syrians
48.4
/100
|
#176
Average
12.8%
Immigrants | Canada
44.8
/100
|
#177
Average
12.8%
Immigrants | Switzerland
43.1
/100
|
#178
Average
12.8%
Israelis
41.0
/100
|
#179
Average
12.9%
Immigrants | North America
37.7
/100
|
#180
Fair
12.9%
Panamanians
37.6
/100
|
#181
Fair
12.9%
Moroccans
36.8
/100
|
#182
Fair
12.9%
Immigrants | West Indies
33.0
/100
|
#183
Fair
12.9%
Immigrants | Trinidad and Tobago
32.5
/100
|
#184
Fair
12.9%
Norwegians
32.0
/100
|
#185
Fair
12.9%
Nigerians
31.9
/100
|
#186
Fair
12.9%
Immigrants | Kuwait
31.9
/100
|
#187
Fair
12.9%
Macedonians
31.5
/100
|
#188
Fair
12.9%
Portuguese
30.2
/100
|
#189
Fair
12.9%

Demographics Similar to Immigrants from Kenya by Single Male Poverty

In terms of single male poverty, the demographic groups most similar to Immigrants from Kenya are Russian (12.5%, a difference of 0.030%), Serbian (12.5%, a difference of 0.040%), Immigrants from Jordan (12.5%, a difference of 0.060%), Icelander (12.5%, a difference of 0.090%), and Romanian (12.5%, a difference of 0.14%).
DemographicsRating | RankSingle Male Poverty
Immigrants | Syria
91.2
/100
|
#116
Exceptional
12.4%
Immigrants | Oceania
91.1
/100
|
#117
Exceptional
12.4%
Albanians
90.6
/100
|
#118
Exceptional
12.4%
Immigrants | Albania
90.3
/100
|
#119
Exceptional
12.4%
Venezuelans
89.4
/100
|
#120
Excellent
12.4%
Icelanders
88.2
/100
|
#121
Excellent
12.5%
Serbians
87.9
/100
|
#122
Excellent
12.5%
Immigrants | Kenya
87.6
/100
|
#123
Excellent
12.5%
Russians
87.3
/100
|
#124
Excellent
12.5%
Immigrants | Jordan
87.1
/100
|
#125
Excellent
12.5%
Romanians
86.4
/100
|
#126
Excellent
12.5%
Immigrants | Netherlands
86.2
/100
|
#127
Excellent
12.5%
Ecuadorians
85.9
/100
|
#128
Excellent
12.5%
Immigrants | Sierra Leone
85.5
/100
|
#129
Excellent
12.5%
Immigrants | Nicaragua
84.8
/100
|
#130
Excellent
12.5%