Moroccan vs Immigrants from Lithuania 1 or more Vehicles in Household
COMPARE
Moroccan
Immigrants from Lithuania
1 or more Vehicles in Household
1 or more Vehicles in Household Comparison
Moroccans
Immigrants from Lithuania
85.4%
1 OR MORE VEHICLES IN HOUSEHOLD
0.0/ 100
METRIC RATING
302nd/ 347
METRIC RANK
90.2%
1 OR MORE VEHICLES IN HOUSEHOLD
83.0/ 100
METRIC RATING
142nd/ 347
METRIC RANK
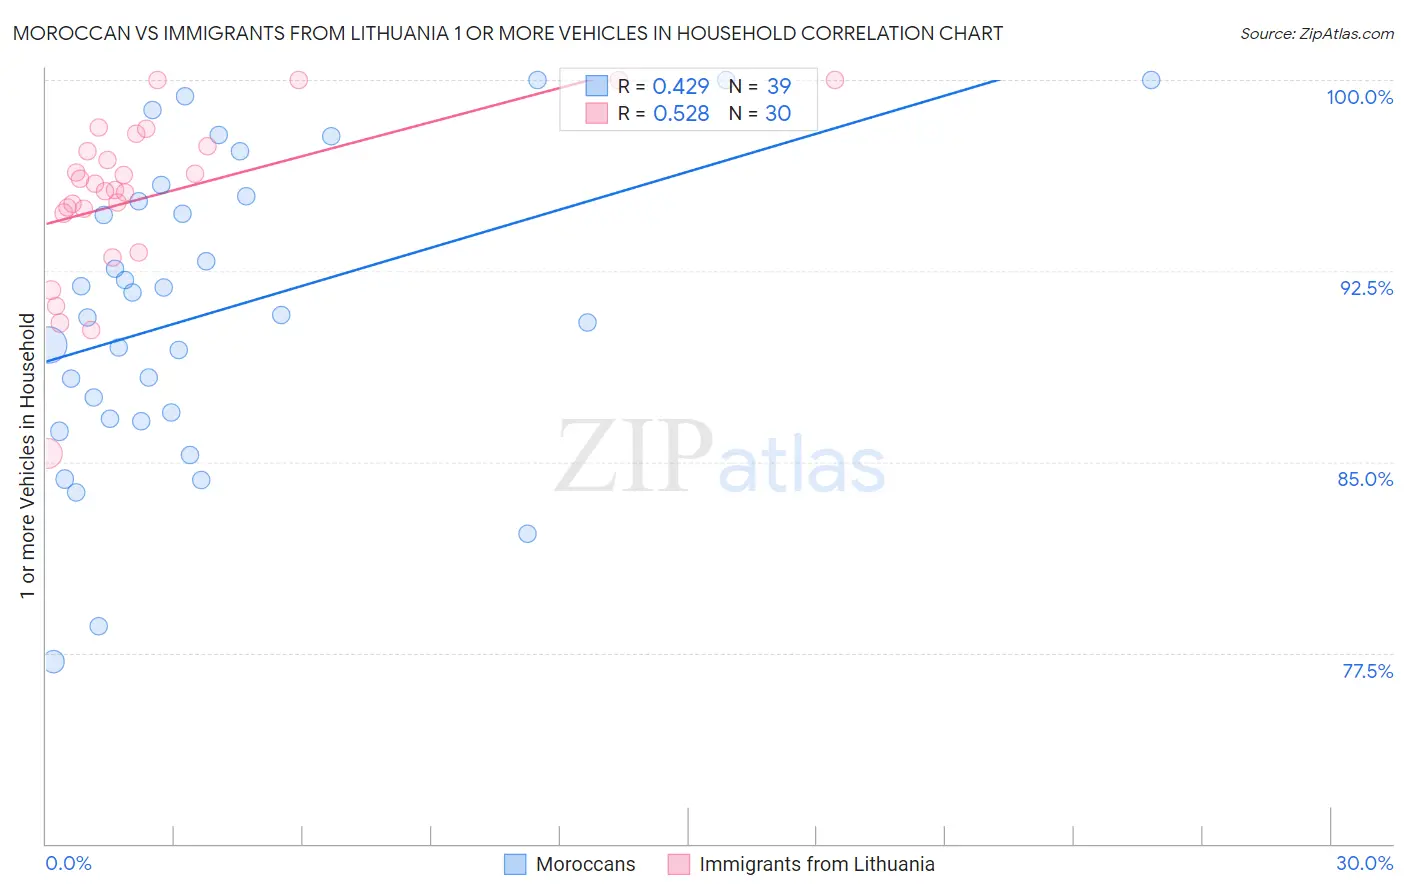
Moroccan vs Immigrants from Lithuania 1 or more Vehicles in Household Correlation Chart
The statistical analysis conducted on geographies consisting of 201,766,092 people shows a moderate positive correlation between the proportion of Moroccans and percentage of households with 1 or more vehicles available in the United States with a correlation coefficient (R) of 0.429 and weighted average of 85.4%. Similarly, the statistical analysis conducted on geographies consisting of 117,713,976 people shows a substantial positive correlation between the proportion of Immigrants from Lithuania and percentage of households with 1 or more vehicles available in the United States with a correlation coefficient (R) of 0.528 and weighted average of 90.2%, a difference of 5.7%.
1 or more Vehicles in Household Correlation Summary
| Measurement | Moroccan | Immigrants from Lithuania |
| Minimum | 77.2% | 85.3% |
| Maximum | 100.0% | 100.0% |
| Range | 22.8% | 14.7% |
| Mean | 90.9% | 95.4% |
| Median | 90.8% | 95.8% |
| Interquartile 25% (IQ1) | 86.7% | 94.8% |
| Interquartile 75% (IQ3) | 95.5% | 97.4% |
| Interquartile Range (IQR) | 8.7% | 2.6% |
| Standard Deviation (Sample) | 5.9% | 3.3% |
| Standard Deviation (Population) | 5.8% | 3.2% |
Similar Demographics by 1 or more Vehicles in Household
Demographics Similar to Moroccans by 1 or more Vehicles in Household
In terms of 1 or more vehicles in household, the demographic groups most similar to Moroccans are Immigrants from Panama (85.4%, a difference of 0.020%), Immigrants from Greece (85.4%, a difference of 0.030%), Immigrants from Russia (85.4%, a difference of 0.060%), Yuman (85.5%, a difference of 0.070%), and Immigrants from Ukraine (85.2%, a difference of 0.20%).
| Demographics | Rating | Rank | 1 or more Vehicles in Household |
| Immigrants | Jamaica | 0.0 /100 | #295 | Tragic 85.8% |
| Immigrants | Spain | 0.0 /100 | #296 | Tragic 85.8% |
| Paraguayans | 0.0 /100 | #297 | Tragic 85.7% |
| Belizeans | 0.0 /100 | #298 | Tragic 85.7% |
| Yuman | 0.0 /100 | #299 | Tragic 85.5% |
| Immigrants | Russia | 0.0 /100 | #300 | Tragic 85.4% |
| Immigrants | Panama | 0.0 /100 | #301 | Tragic 85.4% |
| Moroccans | 0.0 /100 | #302 | Tragic 85.4% |
| Immigrants | Greece | 0.0 /100 | #303 | Tragic 85.4% |
| Immigrants | Ukraine | 0.0 /100 | #304 | Tragic 85.2% |
| Immigrants | China | 0.0 /100 | #305 | Tragic 84.9% |
| Immigrants | Western Africa | 0.0 /100 | #306 | Tragic 84.9% |
| Tohono O'odham | 0.0 /100 | #307 | Tragic 84.7% |
| Immigrants | Belize | 0.0 /100 | #308 | Tragic 84.7% |
| Immigrants | Haiti | 0.0 /100 | #309 | Tragic 84.7% |
Demographics Similar to Immigrants from Lithuania by 1 or more Vehicles in Household
In terms of 1 or more vehicles in household, the demographic groups most similar to Immigrants from Lithuania are Immigrants from Moldova (90.2%, a difference of 0.0%), Immigrants from Bahamas (90.2%, a difference of 0.040%), Immigrants from Zimbabwe (90.2%, a difference of 0.040%), Sioux (90.2%, a difference of 0.040%), and Sudanese (90.3%, a difference of 0.060%).
| Demographics | Rating | Rank | 1 or more Vehicles in Household |
| Immigrants | Oceania | 86.9 /100 | #135 | Excellent 90.4% |
| Hungarians | 86.5 /100 | #136 | Excellent 90.3% |
| Latvians | 86.3 /100 | #137 | Excellent 90.3% |
| Syrians | 86.3 /100 | #138 | Excellent 90.3% |
| Estonians | 85.6 /100 | #139 | Excellent 90.3% |
| Sudanese | 85.2 /100 | #140 | Excellent 90.3% |
| Immigrants | Moldova | 83.1 /100 | #141 | Excellent 90.2% |
| Immigrants | Lithuania | 83.0 /100 | #142 | Excellent 90.2% |
| Immigrants | Bahamas | 81.5 /100 | #143 | Excellent 90.2% |
| Immigrants | Zimbabwe | 81.5 /100 | #144 | Excellent 90.2% |
| Sioux | 81.3 /100 | #145 | Excellent 90.2% |
| Bahamians | 80.5 /100 | #146 | Excellent 90.2% |
| Chileans | 79.8 /100 | #147 | Good 90.2% |
| Immigrants | Eastern Africa | 78.2 /100 | #148 | Good 90.1% |
| Immigrants | Nicaragua | 76.7 /100 | #149 | Good 90.1% |