Moroccan vs Immigrants from Congo Divorced or Separated
COMPARE
Moroccan
Immigrants from Congo
Divorced or Separated
Divorced or Separated Comparison
Moroccans
Immigrants from Congo
12.1%
DIVORCED OR SEPARATED
34.8/ 100
METRIC RATING
190th/ 347
METRIC RANK
13.5%
DIVORCED OR SEPARATED
0.0/ 100
METRIC RATING
326th/ 347
METRIC RANK
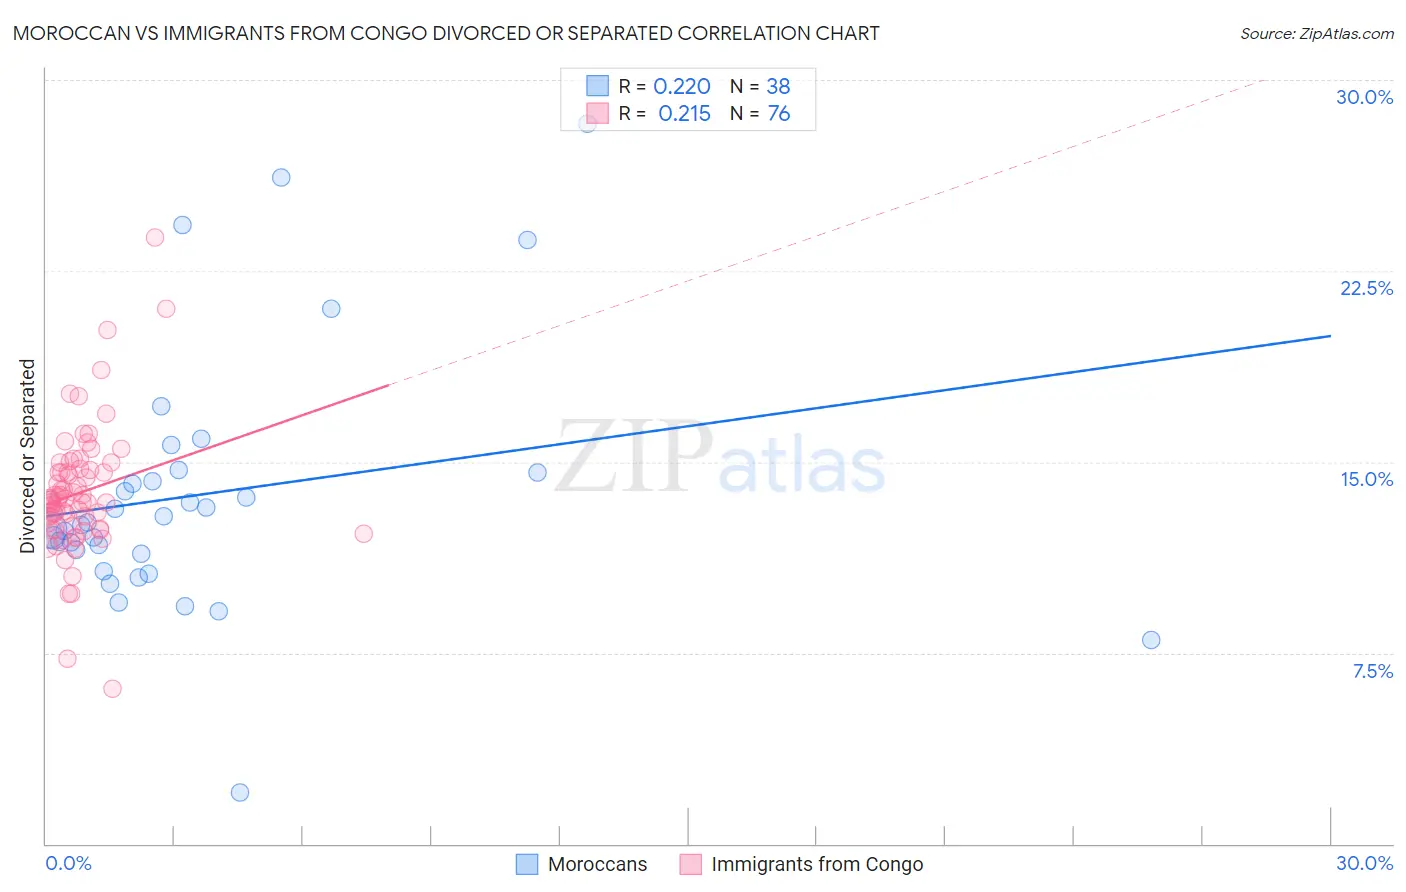
Moroccan vs Immigrants from Congo Divorced or Separated Correlation Chart
The statistical analysis conducted on geographies consisting of 201,776,444 people shows a weak positive correlation between the proportion of Moroccans and percentage of population currently divorced or separated in the United States with a correlation coefficient (R) of 0.220 and weighted average of 12.1%. Similarly, the statistical analysis conducted on geographies consisting of 92,097,616 people shows a weak positive correlation between the proportion of Immigrants from Congo and percentage of population currently divorced or separated in the United States with a correlation coefficient (R) of 0.215 and weighted average of 13.5%, a difference of 11.0%.
Divorced or Separated Correlation Summary
| Measurement | Moroccan | Immigrants from Congo |
| Minimum | 2.0% | 6.1% |
| Maximum | 28.3% | 23.8% |
| Range | 26.3% | 17.7% |
| Mean | 13.7% | 13.8% |
| Median | 12.6% | 13.5% |
| Interquartile 25% (IQ1) | 11.4% | 12.4% |
| Interquartile 75% (IQ3) | 14.6% | 14.7% |
| Interquartile Range (IQR) | 3.2% | 2.3% |
| Standard Deviation (Sample) | 5.1% | 2.6% |
| Standard Deviation (Population) | 5.0% | 2.6% |
Similar Demographics by Divorced or Separated
Demographics Similar to Moroccans by Divorced or Separated
In terms of divorced or separated, the demographic groups most similar to Moroccans are Swedish (12.1%, a difference of 0.020%), Sierra Leonean (12.1%, a difference of 0.030%), Norwegian (12.1%, a difference of 0.060%), Immigrants from Thailand (12.1%, a difference of 0.090%), and Immigrants from Belize (12.1%, a difference of 0.10%).
| Demographics | Rating | Rank | Divorced or Separated |
| Immigrants | Central America | 42.9 /100 | #183 | Average 12.1% |
| Immigrants | North America | 41.1 /100 | #184 | Average 12.1% |
| Immigrants | Nigeria | 40.5 /100 | #185 | Average 12.1% |
| Immigrants | Chile | 39.0 /100 | #186 | Fair 12.1% |
| Belizeans | 37.7 /100 | #187 | Fair 12.1% |
| Immigrants | Belize | 37.6 /100 | #188 | Fair 12.1% |
| Sierra Leoneans | 35.5 /100 | #189 | Fair 12.1% |
| Moroccans | 34.8 /100 | #190 | Fair 12.1% |
| Swedes | 34.4 /100 | #191 | Fair 12.1% |
| Norwegians | 33.2 /100 | #192 | Fair 12.1% |
| Immigrants | Thailand | 32.5 /100 | #193 | Fair 12.1% |
| Immigrants | Eritrea | 31.9 /100 | #194 | Fair 12.1% |
| Immigrants | England | 31.4 /100 | #195 | Fair 12.1% |
| Immigrants | Burma/Myanmar | 30.4 /100 | #196 | Fair 12.1% |
| Immigrants | Africa | 30.3 /100 | #197 | Fair 12.1% |
Demographics Similar to Immigrants from Congo by Divorced or Separated
In terms of divorced or separated, the demographic groups most similar to Immigrants from Congo are Potawatomi (13.5%, a difference of 0.010%), Osage (13.4%, a difference of 0.070%), U.S. Virgin Islander (13.4%, a difference of 0.14%), Immigrants from Haiti (13.4%, a difference of 0.36%), and Comanche (13.5%, a difference of 0.48%).
| Demographics | Rating | Rank | Divorced or Separated |
| Puget Sound Salish | 0.0 /100 | #319 | Tragic 13.4% |
| Cajuns | 0.0 /100 | #320 | Tragic 13.4% |
| Cheyenne | 0.0 /100 | #321 | Tragic 13.4% |
| Immigrants | Haiti | 0.0 /100 | #322 | Tragic 13.4% |
| U.S. Virgin Islanders | 0.0 /100 | #323 | Tragic 13.4% |
| Osage | 0.0 /100 | #324 | Tragic 13.4% |
| Potawatomi | 0.0 /100 | #325 | Tragic 13.5% |
| Immigrants | Congo | 0.0 /100 | #326 | Tragic 13.5% |
| Comanche | 0.0 /100 | #327 | Tragic 13.5% |
| Immigrants | Caribbean | 0.0 /100 | #328 | Tragic 13.6% |
| Houma | 0.0 /100 | #329 | Tragic 13.6% |
| Paiute | 0.0 /100 | #330 | Tragic 13.6% |
| Blacks/African Americans | 0.0 /100 | #331 | Tragic 13.6% |
| Cherokee | 0.0 /100 | #332 | Tragic 13.7% |
| Puerto Ricans | 0.0 /100 | #333 | Tragic 13.9% |