Moroccan vs Immigrants from Congo Seniors Poverty Over the Age of 65
COMPARE
Moroccan
Immigrants from Congo
Seniors Poverty Over the Age of 65
Seniors Poverty Over the Age of 65 Comparison
Moroccans
Immigrants from Congo
12.0%
SENIORS POVERTY OVER THE AGE OF 65
1.2/ 100
METRIC RATING
237th/ 347
METRIC RANK
11.7%
SENIORS POVERTY OVER THE AGE OF 65
3.8/ 100
METRIC RATING
223rd/ 347
METRIC RANK
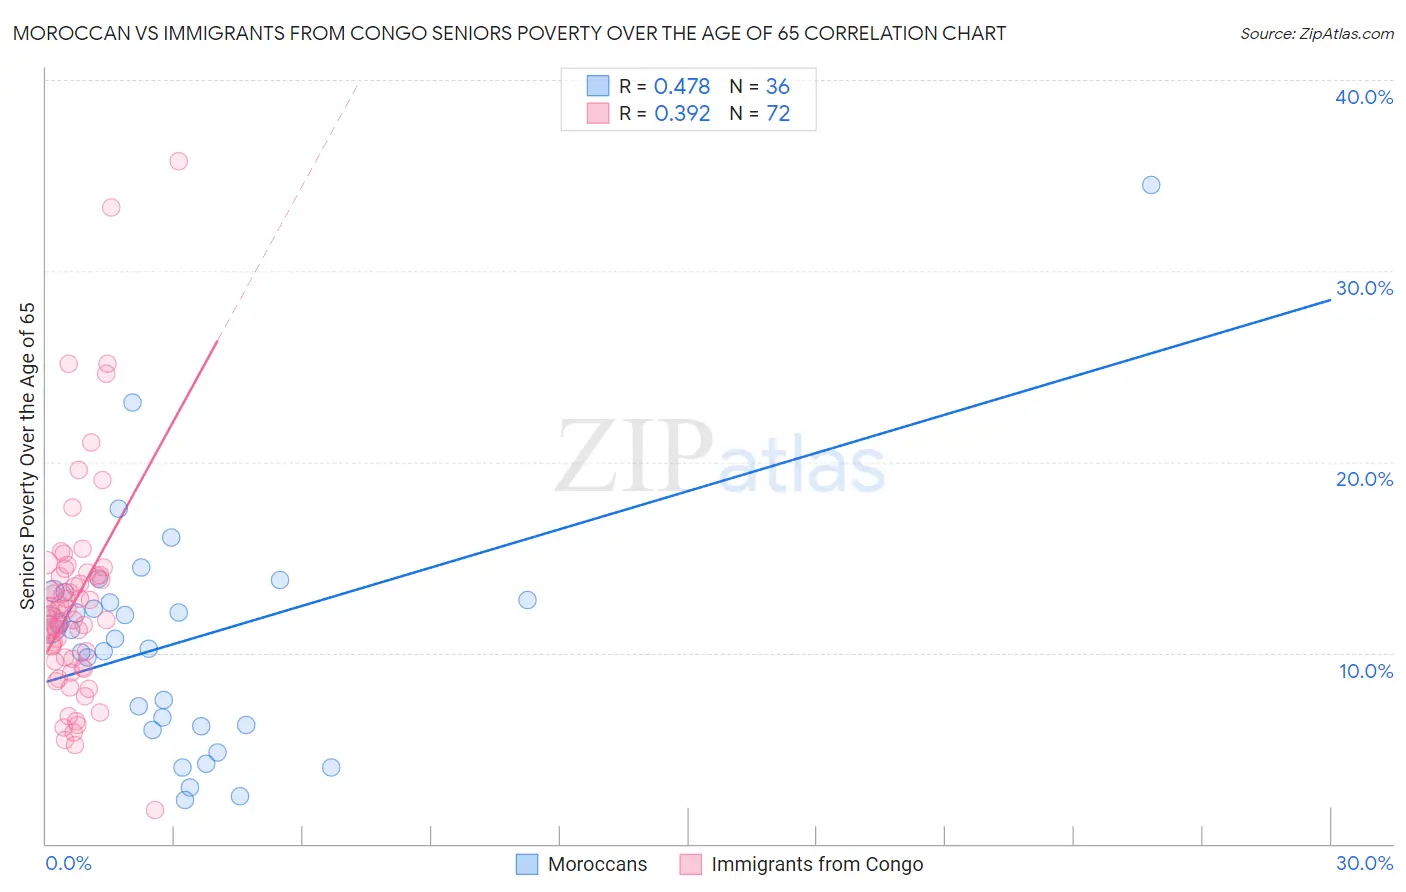
Moroccan vs Immigrants from Congo Seniors Poverty Over the Age of 65 Correlation Chart
The statistical analysis conducted on geographies consisting of 201,496,843 people shows a moderate positive correlation between the proportion of Moroccans and poverty level among seniors over the age of 65 in the United States with a correlation coefficient (R) of 0.478 and weighted average of 12.0%. Similarly, the statistical analysis conducted on geographies consisting of 92,025,514 people shows a mild positive correlation between the proportion of Immigrants from Congo and poverty level among seniors over the age of 65 in the United States with a correlation coefficient (R) of 0.392 and weighted average of 11.7%, a difference of 2.4%.
Seniors Poverty Over the Age of 65 Correlation Summary
| Measurement | Moroccan | Immigrants from Congo |
| Minimum | 2.3% | 1.7% |
| Maximum | 34.5% | 35.7% |
| Range | 32.2% | 34.0% |
| Mean | 10.6% | 12.7% |
| Median | 11.0% | 11.9% |
| Interquartile 25% (IQ1) | 6.2% | 9.6% |
| Interquartile 75% (IQ3) | 13.0% | 14.0% |
| Interquartile Range (IQR) | 6.8% | 4.4% |
| Standard Deviation (Sample) | 6.2% | 5.7% |
| Standard Deviation (Population) | 6.1% | 5.7% |
Demographics Similar to Moroccans and Immigrants from Congo by Seniors Poverty Over the Age of 65
In terms of seniors poverty over the age of 65, the demographic groups most similar to Moroccans are Immigrants from Peru (12.0%, a difference of 0.15%), Immigrants from Argentina (12.0%, a difference of 0.18%), Seminole (12.0%, a difference of 0.21%), Immigrants from Spain (12.1%, a difference of 0.48%), and Comanche (12.1%, a difference of 0.58%). Similarly, the demographic groups most similar to Immigrants from Congo are Immigrants from Chile (11.7%, a difference of 0.040%), Argentinean (11.7%, a difference of 0.15%), Peruvian (11.7%, a difference of 0.22%), Immigrants from Nigeria (11.7%, a difference of 0.24%), and Immigrants from Belarus (11.8%, a difference of 0.34%).
| Demographics | Rating | Rank | Seniors Poverty Over the Age of 65 |
| Peruvians | 4.2 /100 | #220 | Tragic 11.7% |
| Argentineans | 4.1 /100 | #221 | Tragic 11.7% |
| Immigrants | Chile | 3.9 /100 | #222 | Tragic 11.7% |
| Immigrants | Congo | 3.8 /100 | #223 | Tragic 11.7% |
| Immigrants | Nigeria | 3.4 /100 | #224 | Tragic 11.7% |
| Immigrants | Belarus | 3.2 /100 | #225 | Tragic 11.8% |
| Liberians | 3.2 /100 | #226 | Tragic 11.8% |
| Nigerians | 3.2 /100 | #227 | Tragic 11.8% |
| Immigrants | Costa Rica | 2.7 /100 | #228 | Tragic 11.8% |
| Immigrants | Eritrea | 2.6 /100 | #229 | Tragic 11.8% |
| Bermudans | 2.1 /100 | #230 | Tragic 11.9% |
| Cajuns | 2.0 /100 | #231 | Tragic 11.9% |
| Yaqui | 1.9 /100 | #232 | Tragic 11.9% |
| Panamanians | 1.8 /100 | #233 | Tragic 11.9% |
| Iroquois | 1.7 /100 | #234 | Tragic 11.9% |
| Immigrants | Argentina | 1.3 /100 | #235 | Tragic 12.0% |
| Immigrants | Peru | 1.3 /100 | #236 | Tragic 12.0% |
| Moroccans | 1.2 /100 | #237 | Tragic 12.0% |
| Seminole | 1.1 /100 | #238 | Tragic 12.0% |
| Immigrants | Spain | 1.0 /100 | #239 | Tragic 12.1% |
| Comanche | 0.9 /100 | #240 | Tragic 12.1% |