Mexican vs Trinidadian and Tobagonian Single Father Poverty
COMPARE
Mexican
Trinidadian and Tobagonian
Single Father Poverty
Single Father Poverty Comparison
Mexicans
Trinidadians and Tobagonians
16.1%
SINGLE FATHER POVERTY
70.1/ 100
METRIC RATING
154th/ 347
METRIC RANK
17.0%
SINGLE FATHER POVERTY
1.5/ 100
METRIC RATING
245th/ 347
METRIC RANK
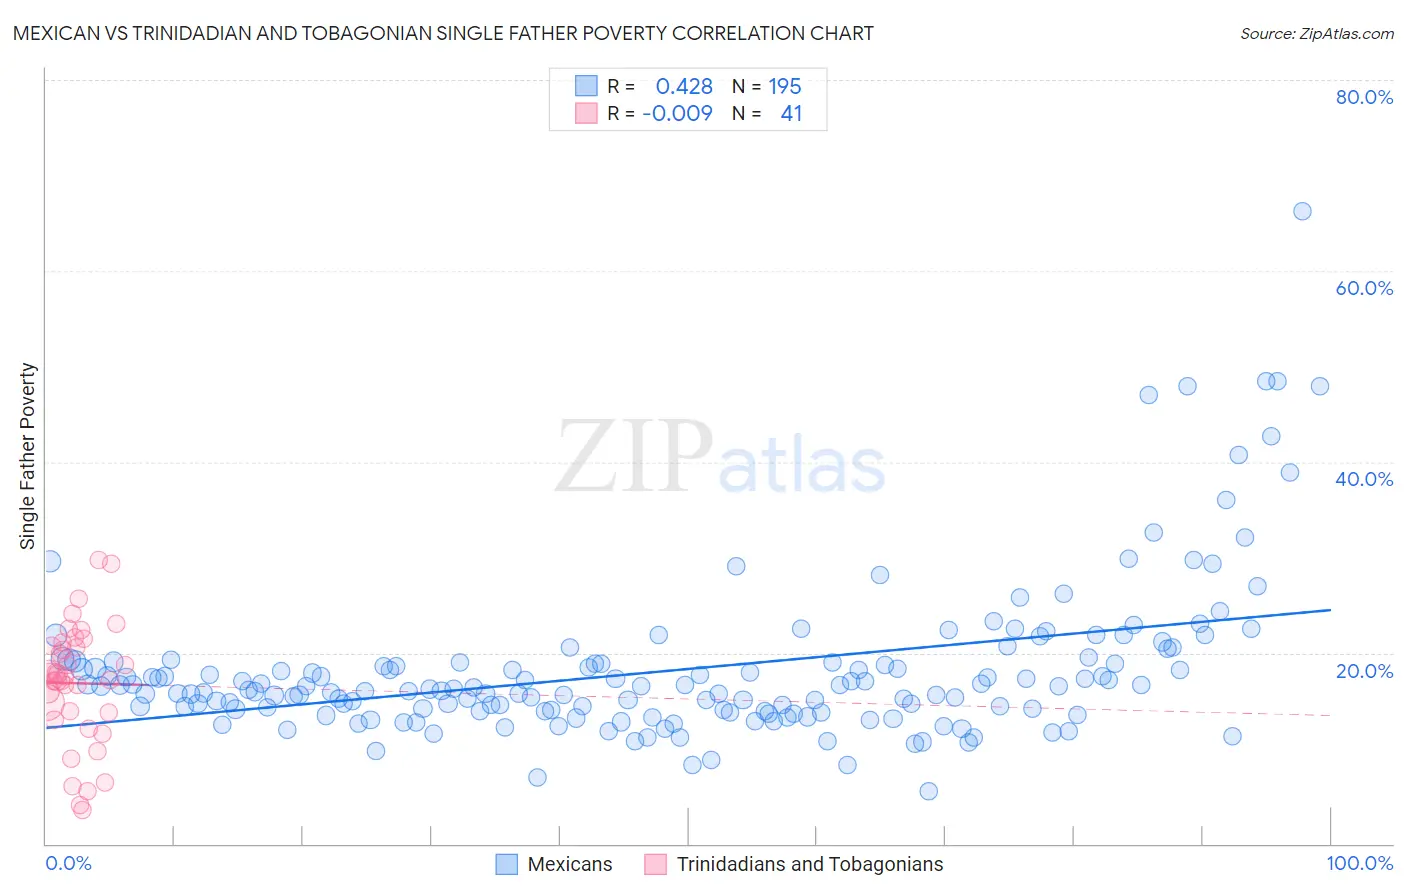
Mexican vs Trinidadian and Tobagonian Single Father Poverty Correlation Chart
The statistical analysis conducted on geographies consisting of 409,525,490 people shows a moderate positive correlation between the proportion of Mexicans and poverty level among single fathers in the United States with a correlation coefficient (R) of 0.428 and weighted average of 16.1%. Similarly, the statistical analysis conducted on geographies consisting of 188,831,779 people shows no correlation between the proportion of Trinidadians and Tobagonians and poverty level among single fathers in the United States with a correlation coefficient (R) of -0.009 and weighted average of 17.0%, a difference of 5.6%.
Single Father Poverty Correlation Summary
| Measurement | Mexican | Trinidadian and Tobagonian |
| Minimum | 5.5% | 3.5% |
| Maximum | 66.2% | 29.7% |
| Range | 60.7% | 26.2% |
| Mean | 18.2% | 16.8% |
| Median | 16.2% | 17.5% |
| Interquartile 25% (IQ1) | 13.9% | 13.4% |
| Interquartile 75% (IQ3) | 19.0% | 20.9% |
| Interquartile Range (IQR) | 5.1% | 7.6% |
| Standard Deviation (Sample) | 8.2% | 6.3% |
| Standard Deviation (Population) | 8.1% | 6.2% |
Similar Demographics by Single Father Poverty
Demographics Similar to Mexicans by Single Father Poverty
In terms of single father poverty, the demographic groups most similar to Mexicans are Immigrants from Zimbabwe (16.1%, a difference of 0.10%), Immigrants from Israel (16.1%, a difference of 0.10%), Immigrants from Nicaragua (16.2%, a difference of 0.12%), Immigrants from France (16.1%, a difference of 0.16%), and Immigrants from Jordan (16.2%, a difference of 0.21%).
| Demographics | Rating | Rank | Single Father Poverty |
| Colombians | 77.1 /100 | #147 | Good 16.1% |
| Nigerians | 76.8 /100 | #148 | Good 16.1% |
| South Africans | 75.1 /100 | #149 | Good 16.1% |
| Jordanians | 74.2 /100 | #150 | Good 16.1% |
| Immigrants | France | 73.1 /100 | #151 | Good 16.1% |
| Immigrants | Zimbabwe | 72.1 /100 | #152 | Good 16.1% |
| Immigrants | Israel | 72.0 /100 | #153 | Good 16.1% |
| Mexicans | 70.1 /100 | #154 | Good 16.1% |
| Immigrants | Nicaragua | 67.8 /100 | #155 | Good 16.2% |
| Immigrants | Jordan | 66.0 /100 | #156 | Good 16.2% |
| Immigrants | Czechoslovakia | 62.8 /100 | #157 | Good 16.2% |
| Portuguese | 62.3 /100 | #158 | Good 16.2% |
| Belizeans | 59.9 /100 | #159 | Average 16.2% |
| Immigrants | Sudan | 59.8 /100 | #160 | Average 16.2% |
| Estonians | 56.7 /100 | #161 | Average 16.2% |
Demographics Similar to Trinidadians and Tobagonians by Single Father Poverty
In terms of single father poverty, the demographic groups most similar to Trinidadians and Tobagonians are Honduran (17.0%, a difference of 0.040%), Immigrants from Ireland (17.1%, a difference of 0.040%), Immigrants from Cabo Verde (17.0%, a difference of 0.060%), Greek (17.1%, a difference of 0.14%), and Czechoslovakian (17.1%, a difference of 0.14%).
| Demographics | Rating | Rank | Single Father Poverty |
| Immigrants | Saudi Arabia | 2.7 /100 | #238 | Tragic 16.9% |
| Bermudans | 2.6 /100 | #239 | Tragic 16.9% |
| Finns | 2.6 /100 | #240 | Tragic 16.9% |
| Czechs | 2.3 /100 | #241 | Tragic 17.0% |
| Moroccans | 2.1 /100 | #242 | Tragic 17.0% |
| Immigrants | Cabo Verde | 1.6 /100 | #243 | Tragic 17.0% |
| Hondurans | 1.6 /100 | #244 | Tragic 17.0% |
| Trinidadians and Tobagonians | 1.5 /100 | #245 | Tragic 17.0% |
| Immigrants | Ireland | 1.4 /100 | #246 | Tragic 17.1% |
| Greeks | 1.3 /100 | #247 | Tragic 17.1% |
| Czechoslovakians | 1.3 /100 | #248 | Tragic 17.1% |
| Canadians | 1.3 /100 | #249 | Tragic 17.1% |
| Austrians | 1.1 /100 | #250 | Tragic 17.1% |
| Luxembourgers | 1.1 /100 | #251 | Tragic 17.1% |
| Croatians | 1.0 /100 | #252 | Tragic 17.1% |