Mexican vs Osage Single Father Poverty
COMPARE
Mexican
Osage
Single Father Poverty
Single Father Poverty Comparison
Mexicans
Osage
16.1%
SINGLE FATHER POVERTY
70.1/ 100
METRIC RATING
154th/ 347
METRIC RANK
19.0%
SINGLE FATHER POVERTY
0.0/ 100
METRIC RATING
316th/ 347
METRIC RANK
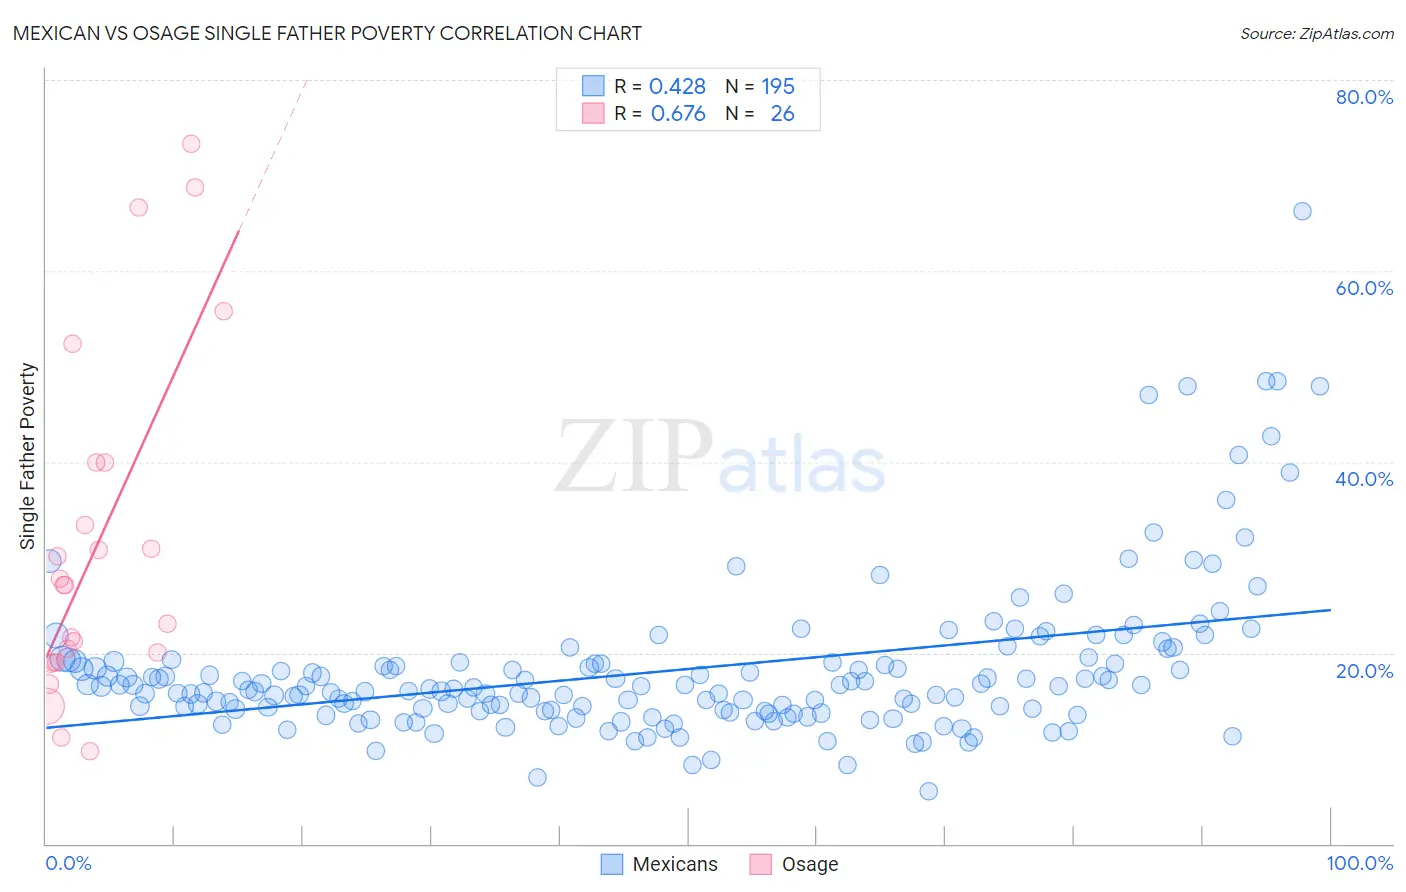
Mexican vs Osage Single Father Poverty Correlation Chart
The statistical analysis conducted on geographies consisting of 409,525,490 people shows a moderate positive correlation between the proportion of Mexicans and poverty level among single fathers in the United States with a correlation coefficient (R) of 0.428 and weighted average of 16.1%. Similarly, the statistical analysis conducted on geographies consisting of 82,975,637 people shows a significant positive correlation between the proportion of Osage and poverty level among single fathers in the United States with a correlation coefficient (R) of 0.676 and weighted average of 19.0%, a difference of 17.9%.
Single Father Poverty Correlation Summary
| Measurement | Mexican | Osage |
| Minimum | 5.5% | 9.7% |
| Maximum | 66.2% | 73.3% |
| Range | 60.7% | 63.7% |
| Mean | 18.2% | 31.5% |
| Median | 16.2% | 27.1% |
| Interquartile 25% (IQ1) | 13.9% | 19.0% |
| Interquartile 75% (IQ3) | 19.0% | 40.0% |
| Interquartile Range (IQR) | 5.1% | 21.0% |
| Standard Deviation (Sample) | 8.2% | 17.9% |
| Standard Deviation (Population) | 8.1% | 17.5% |
Similar Demographics by Single Father Poverty
Demographics Similar to Mexicans by Single Father Poverty
In terms of single father poverty, the demographic groups most similar to Mexicans are Immigrants from Zimbabwe (16.1%, a difference of 0.10%), Immigrants from Israel (16.1%, a difference of 0.10%), Immigrants from Nicaragua (16.2%, a difference of 0.12%), Immigrants from France (16.1%, a difference of 0.16%), and Immigrants from Jordan (16.2%, a difference of 0.21%).
| Demographics | Rating | Rank | Single Father Poverty |
| Colombians | 77.1 /100 | #147 | Good 16.1% |
| Nigerians | 76.8 /100 | #148 | Good 16.1% |
| South Africans | 75.1 /100 | #149 | Good 16.1% |
| Jordanians | 74.2 /100 | #150 | Good 16.1% |
| Immigrants | France | 73.1 /100 | #151 | Good 16.1% |
| Immigrants | Zimbabwe | 72.1 /100 | #152 | Good 16.1% |
| Immigrants | Israel | 72.0 /100 | #153 | Good 16.1% |
| Mexicans | 70.1 /100 | #154 | Good 16.1% |
| Immigrants | Nicaragua | 67.8 /100 | #155 | Good 16.2% |
| Immigrants | Jordan | 66.0 /100 | #156 | Good 16.2% |
| Immigrants | Czechoslovakia | 62.8 /100 | #157 | Good 16.2% |
| Portuguese | 62.3 /100 | #158 | Good 16.2% |
| Belizeans | 59.9 /100 | #159 | Average 16.2% |
| Immigrants | Sudan | 59.8 /100 | #160 | Average 16.2% |
| Estonians | 56.7 /100 | #161 | Average 16.2% |
Demographics Similar to Osage by Single Father Poverty
In terms of single father poverty, the demographic groups most similar to Osage are Dominican (19.1%, a difference of 0.31%), Chickasaw (19.0%, a difference of 0.40%), Delaware (18.9%, a difference of 0.56%), Potawatomi (18.9%, a difference of 0.72%), and Dutch West Indian (19.2%, a difference of 0.89%).
| Demographics | Rating | Rank | Single Father Poverty |
| Immigrants | Micronesia | 0.0 /100 | #309 | Tragic 18.6% |
| Chippewa | 0.0 /100 | #310 | Tragic 18.8% |
| Immigrants | Nonimmigrants | 0.0 /100 | #311 | Tragic 18.8% |
| Immigrants | Dominica | 0.0 /100 | #312 | Tragic 18.9% |
| Potawatomi | 0.0 /100 | #313 | Tragic 18.9% |
| Delaware | 0.0 /100 | #314 | Tragic 18.9% |
| Chickasaw | 0.0 /100 | #315 | Tragic 19.0% |
| Osage | 0.0 /100 | #316 | Tragic 19.0% |
| Dominicans | 0.0 /100 | #317 | Tragic 19.1% |
| Dutch West Indians | 0.0 /100 | #318 | Tragic 19.2% |
| Slovaks | 0.0 /100 | #319 | Tragic 19.3% |
| Inupiat | 0.0 /100 | #320 | Tragic 19.5% |
| Cherokee | 0.0 /100 | #321 | Tragic 19.6% |
| Creek | 0.0 /100 | #322 | Tragic 19.8% |
| Pennsylvania Germans | 0.0 /100 | #323 | Tragic 20.0% |