Romanian vs Trinidadian and Tobagonian Single Father Poverty
COMPARE
Romanian
Trinidadian and Tobagonian
Single Father Poverty
Single Father Poverty Comparison
Romanians
Trinidadians and Tobagonians
16.5%
SINGLE FATHER POVERTY
20.1/ 100
METRIC RATING
198th/ 347
METRIC RANK
17.0%
SINGLE FATHER POVERTY
1.5/ 100
METRIC RATING
245th/ 347
METRIC RANK
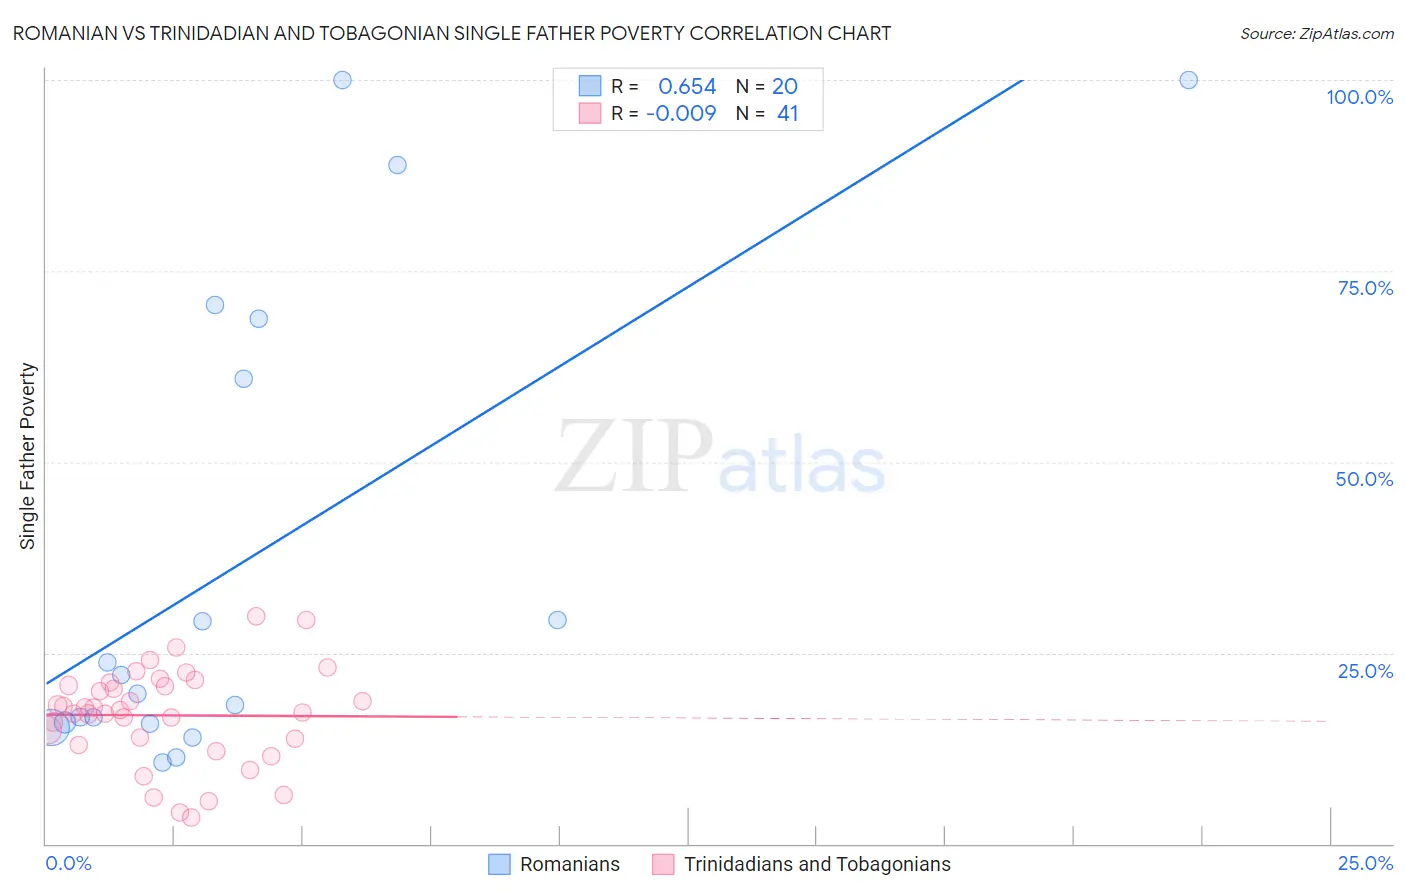
Romanian vs Trinidadian and Tobagonian Single Father Poverty Correlation Chart
The statistical analysis conducted on geographies consisting of 293,248,867 people shows a significant positive correlation between the proportion of Romanians and poverty level among single fathers in the United States with a correlation coefficient (R) of 0.654 and weighted average of 16.5%. Similarly, the statistical analysis conducted on geographies consisting of 188,831,779 people shows no correlation between the proportion of Trinidadians and Tobagonians and poverty level among single fathers in the United States with a correlation coefficient (R) of -0.009 and weighted average of 17.0%, a difference of 3.0%.
Single Father Poverty Correlation Summary
| Measurement | Romanian | Trinidadian and Tobagonian |
| Minimum | 10.6% | 3.5% |
| Maximum | 100.0% | 29.7% |
| Range | 89.4% | 26.2% |
| Mean | 37.3% | 16.8% |
| Median | 20.9% | 17.5% |
| Interquartile 25% (IQ1) | 15.8% | 13.4% |
| Interquartile 75% (IQ3) | 64.8% | 20.9% |
| Interquartile Range (IQR) | 49.0% | 7.6% |
| Standard Deviation (Sample) | 31.3% | 6.3% |
| Standard Deviation (Population) | 30.5% | 6.2% |
Similar Demographics by Single Father Poverty
Demographics Similar to Romanians by Single Father Poverty
In terms of single father poverty, the demographic groups most similar to Romanians are Immigrants from Northern Europe (16.5%, a difference of 0.010%), Immigrants from Belize (16.5%, a difference of 0.020%), Immigrants from Canada (16.5%, a difference of 0.12%), Syrian (16.6%, a difference of 0.19%), and Cuban (16.6%, a difference of 0.26%).
| Demographics | Rating | Rank | Single Father Poverty |
| Immigrants | Guyana | 27.1 /100 | #191 | Fair 16.5% |
| Immigrants | Switzerland | 24.8 /100 | #192 | Fair 16.5% |
| Ecuadorians | 24.5 /100 | #193 | Fair 16.5% |
| Cape Verdeans | 24.4 /100 | #194 | Fair 16.5% |
| Immigrants | Barbados | 24.3 /100 | #195 | Fair 16.5% |
| Immigrants | Canada | 21.9 /100 | #196 | Fair 16.5% |
| Immigrants | Northern Europe | 20.3 /100 | #197 | Fair 16.5% |
| Romanians | 20.1 /100 | #198 | Fair 16.5% |
| Immigrants | Belize | 19.8 /100 | #199 | Poor 16.5% |
| Syrians | 17.4 /100 | #200 | Poor 16.6% |
| Cubans | 16.5 /100 | #201 | Poor 16.6% |
| Immigrants | Croatia | 16.5 /100 | #202 | Poor 16.6% |
| Immigrants | North America | 15.1 /100 | #203 | Poor 16.6% |
| Immigrants | Guatemala | 14.8 /100 | #204 | Poor 16.6% |
| Venezuelans | 14.3 /100 | #205 | Poor 16.6% |
Demographics Similar to Trinidadians and Tobagonians by Single Father Poverty
In terms of single father poverty, the demographic groups most similar to Trinidadians and Tobagonians are Honduran (17.0%, a difference of 0.040%), Immigrants from Ireland (17.1%, a difference of 0.040%), Immigrants from Cabo Verde (17.0%, a difference of 0.060%), Greek (17.1%, a difference of 0.14%), and Czechoslovakian (17.1%, a difference of 0.14%).
| Demographics | Rating | Rank | Single Father Poverty |
| Immigrants | Saudi Arabia | 2.7 /100 | #238 | Tragic 16.9% |
| Bermudans | 2.6 /100 | #239 | Tragic 16.9% |
| Finns | 2.6 /100 | #240 | Tragic 16.9% |
| Czechs | 2.3 /100 | #241 | Tragic 17.0% |
| Moroccans | 2.1 /100 | #242 | Tragic 17.0% |
| Immigrants | Cabo Verde | 1.6 /100 | #243 | Tragic 17.0% |
| Hondurans | 1.6 /100 | #244 | Tragic 17.0% |
| Trinidadians and Tobagonians | 1.5 /100 | #245 | Tragic 17.0% |
| Immigrants | Ireland | 1.4 /100 | #246 | Tragic 17.1% |
| Greeks | 1.3 /100 | #247 | Tragic 17.1% |
| Czechoslovakians | 1.3 /100 | #248 | Tragic 17.1% |
| Canadians | 1.3 /100 | #249 | Tragic 17.1% |
| Austrians | 1.1 /100 | #250 | Tragic 17.1% |
| Luxembourgers | 1.1 /100 | #251 | Tragic 17.1% |
| Croatians | 1.0 /100 | #252 | Tragic 17.1% |