Mexican vs Immigrants from Morocco Single Father Poverty
COMPARE
Mexican
Immigrants from Morocco
Single Father Poverty
Single Father Poverty Comparison
Mexicans
Immigrants from Morocco
16.1%
SINGLE FATHER POVERTY
70.1/ 100
METRIC RATING
154th/ 347
METRIC RANK
16.3%
SINGLE FATHER POVERTY
50.7/ 100
METRIC RATING
171st/ 347
METRIC RANK
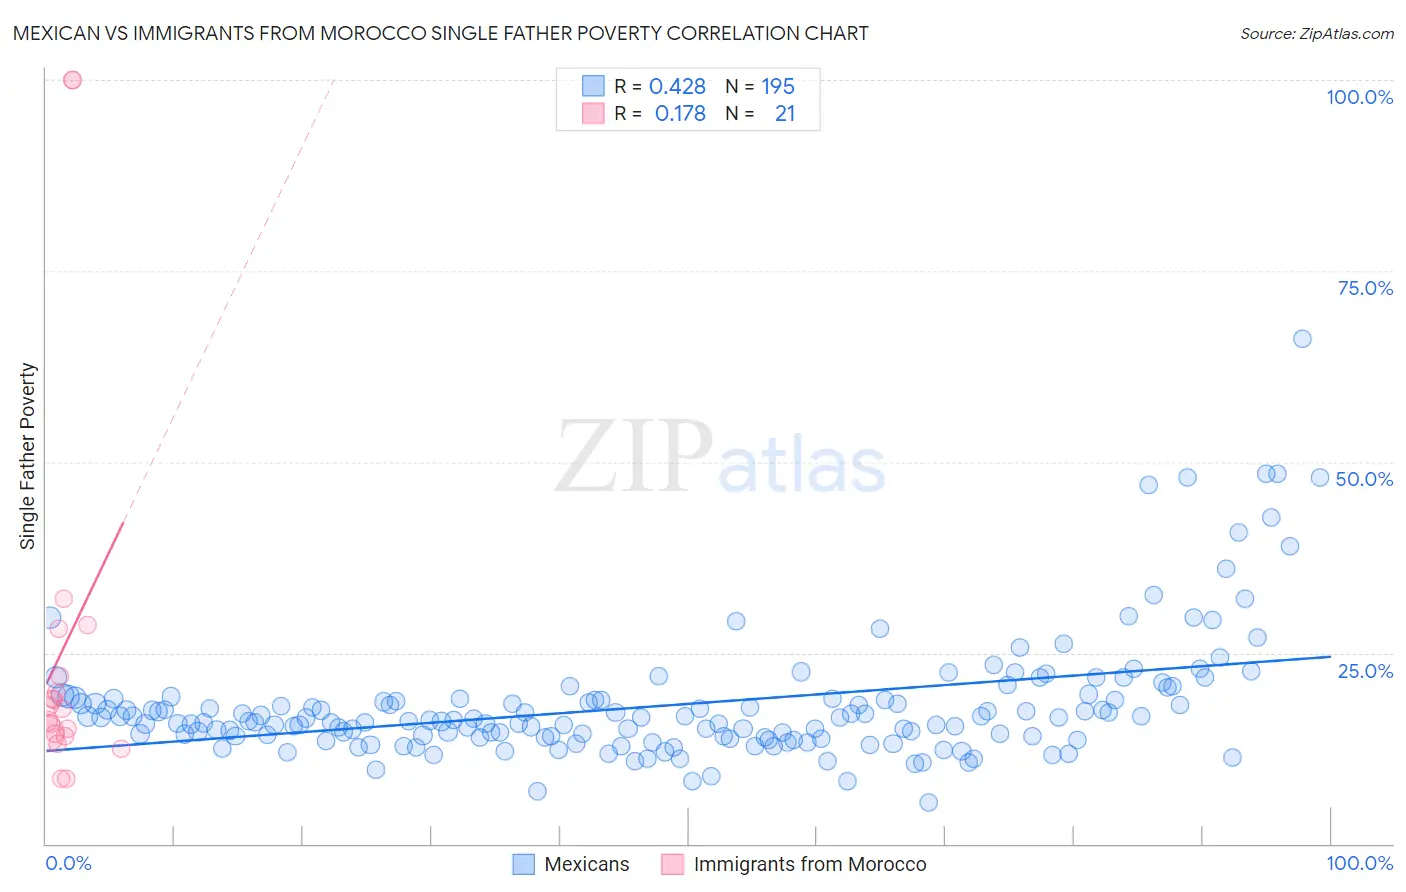
Mexican vs Immigrants from Morocco Single Father Poverty Correlation Chart
The statistical analysis conducted on geographies consisting of 409,525,490 people shows a moderate positive correlation between the proportion of Mexicans and poverty level among single fathers in the United States with a correlation coefficient (R) of 0.428 and weighted average of 16.1%. Similarly, the statistical analysis conducted on geographies consisting of 153,611,026 people shows a poor positive correlation between the proportion of Immigrants from Morocco and poverty level among single fathers in the United States with a correlation coefficient (R) of 0.178 and weighted average of 16.3%, a difference of 0.92%.
Single Father Poverty Correlation Summary
| Measurement | Mexican | Immigrants from Morocco |
| Minimum | 5.5% | 8.5% |
| Maximum | 66.2% | 100.0% |
| Range | 60.7% | 91.5% |
| Mean | 18.2% | 25.5% |
| Median | 16.2% | 17.7% |
| Interquartile 25% (IQ1) | 13.9% | 14.2% |
| Interquartile 75% (IQ3) | 19.0% | 25.0% |
| Interquartile Range (IQR) | 5.1% | 10.8% |
| Standard Deviation (Sample) | 8.2% | 25.5% |
| Standard Deviation (Population) | 8.1% | 24.9% |
Demographics Similar to Mexicans and Immigrants from Morocco by Single Father Poverty
In terms of single father poverty, the demographic groups most similar to Mexicans are Immigrants from Zimbabwe (16.1%, a difference of 0.10%), Immigrants from Israel (16.1%, a difference of 0.10%), Immigrants from Nicaragua (16.2%, a difference of 0.12%), Immigrants from Jordan (16.2%, a difference of 0.21%), and Immigrants from Czechoslovakia (16.2%, a difference of 0.37%). Similarly, the demographic groups most similar to Immigrants from Morocco are Immigrants from Sierra Leone (16.3%, a difference of 0.030%), Scandinavian (16.3%, a difference of 0.070%), Northern European (16.3%, a difference of 0.090%), Costa Rican (16.3%, a difference of 0.13%), and Yugoslavian (16.3%, a difference of 0.14%).
| Demographics | Rating | Rank | Single Father Poverty |
| Immigrants | Zimbabwe | 72.1 /100 | #152 | Good 16.1% |
| Immigrants | Israel | 72.0 /100 | #153 | Good 16.1% |
| Mexicans | 70.1 /100 | #154 | Good 16.1% |
| Immigrants | Nicaragua | 67.8 /100 | #155 | Good 16.2% |
| Immigrants | Jordan | 66.0 /100 | #156 | Good 16.2% |
| Immigrants | Czechoslovakia | 62.8 /100 | #157 | Good 16.2% |
| Portuguese | 62.3 /100 | #158 | Good 16.2% |
| Belizeans | 59.9 /100 | #159 | Average 16.2% |
| Immigrants | Sudan | 59.8 /100 | #160 | Average 16.2% |
| Estonians | 56.7 /100 | #161 | Average 16.2% |
| Ugandans | 55.9 /100 | #162 | Average 16.3% |
| Immigrants | Costa Rica | 55.7 /100 | #163 | Average 16.3% |
| Guyanese | 55.2 /100 | #164 | Average 16.3% |
| Immigrants | Bangladesh | 55.1 /100 | #165 | Average 16.3% |
| Immigrants | Europe | 54.8 /100 | #166 | Average 16.3% |
| Yugoslavians | 53.9 /100 | #167 | Average 16.3% |
| Costa Ricans | 53.6 /100 | #168 | Average 16.3% |
| Northern Europeans | 52.8 /100 | #169 | Average 16.3% |
| Scandinavians | 52.3 /100 | #170 | Average 16.3% |
| Immigrants | Morocco | 50.7 /100 | #171 | Average 16.3% |
| Immigrants | Sierra Leone | 50.1 /100 | #172 | Average 16.3% |